All modulesExample data
Production & Quality
Run continuous improvement on live MES data
Lean Management System maps the value stream from MES data, manages improvement projects, standards and audits, and administers training.
IRISLean Management System10:00
Value stream map
Cut-01C/T 1.9 min
Press-02C/T 1.8 min
Weld-03C/T 2.0 min
Assembly-04C/T 2.1 min
Pack-05C/T 1.7 min
OEE losses
AvailabilityPerformanceQuality
Takt time
2.0 min per unitDemand from the approved MPS, or entered by hand.- Available time
- 450 min
- Daily demand · APS
- 225 pcs
CI portfolio · A3
Shorter Press-02 changeoverOwner: K. WeberSource of each loss
- Availability
- MES measurement
- Performance
- Estimate
- Quality
- MES measurement
Skills matrix
SMED changeoverRequired level 3 · 2 of 6 belowTakt time comes from shift hours and APS demand.
What it does
- 01
Value stream map
Cycle times and status come from MES. Takt comes from shifts and APS demand, or a manual entry. Bottlenecks are marked.
- 02
OEE loss waterfall
Each loss row is labelled MES measurement, estimate or no data.
- 03
CI portfolio
All problems and projects in one list. Size sets the tool: Just Do It, 5 Why, A3, DMAIC or DMADV.
Where the data comes from
- MES: lines, stations, routings, station status and downtime. APS: daily demand from the approved MPS.
- GEMBA and QMS: shared screens for kaizen, A3, 5S, LPA, 5 Why and Ishikawa.
- People: shifts, employees and skills. Course content and test questions are entered by hand.
Good to know
- LMS means Lean Management System, not Learning Management System.
- Training is administered here and taken outside the module. There is no course player or SCORM support.
- LMS does not calculate OEE. It shows the losses MES has calculated.
Screens from the IRIS demo
Sample data from the IRIS demo factory. Click a screen to enlarge it.
Read more
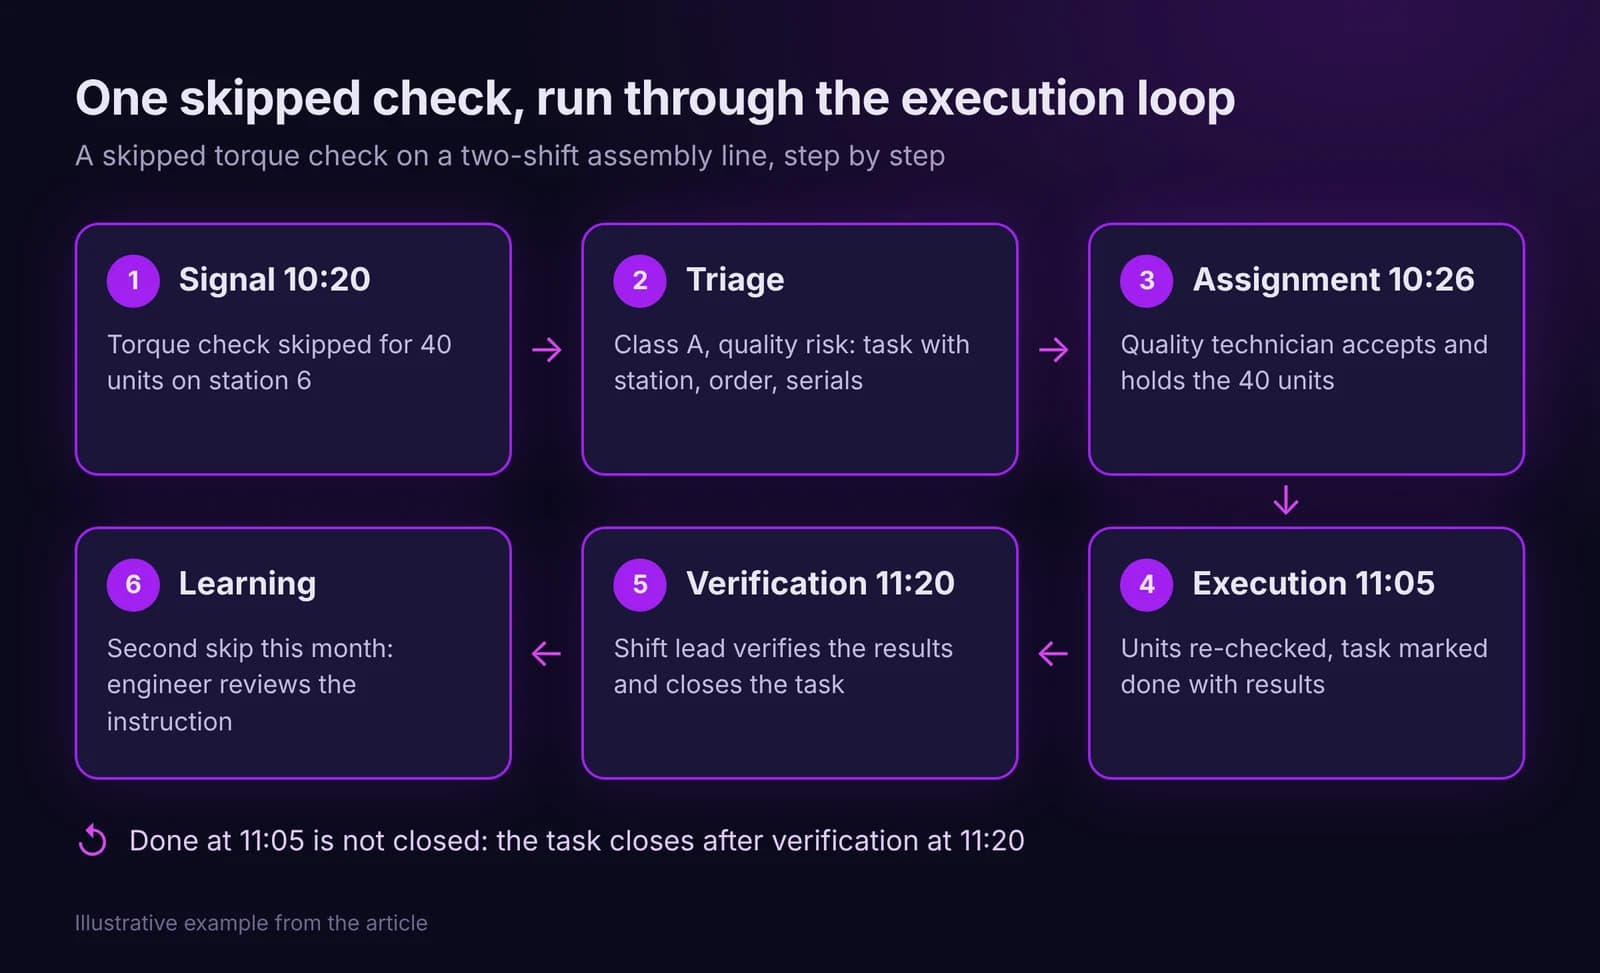
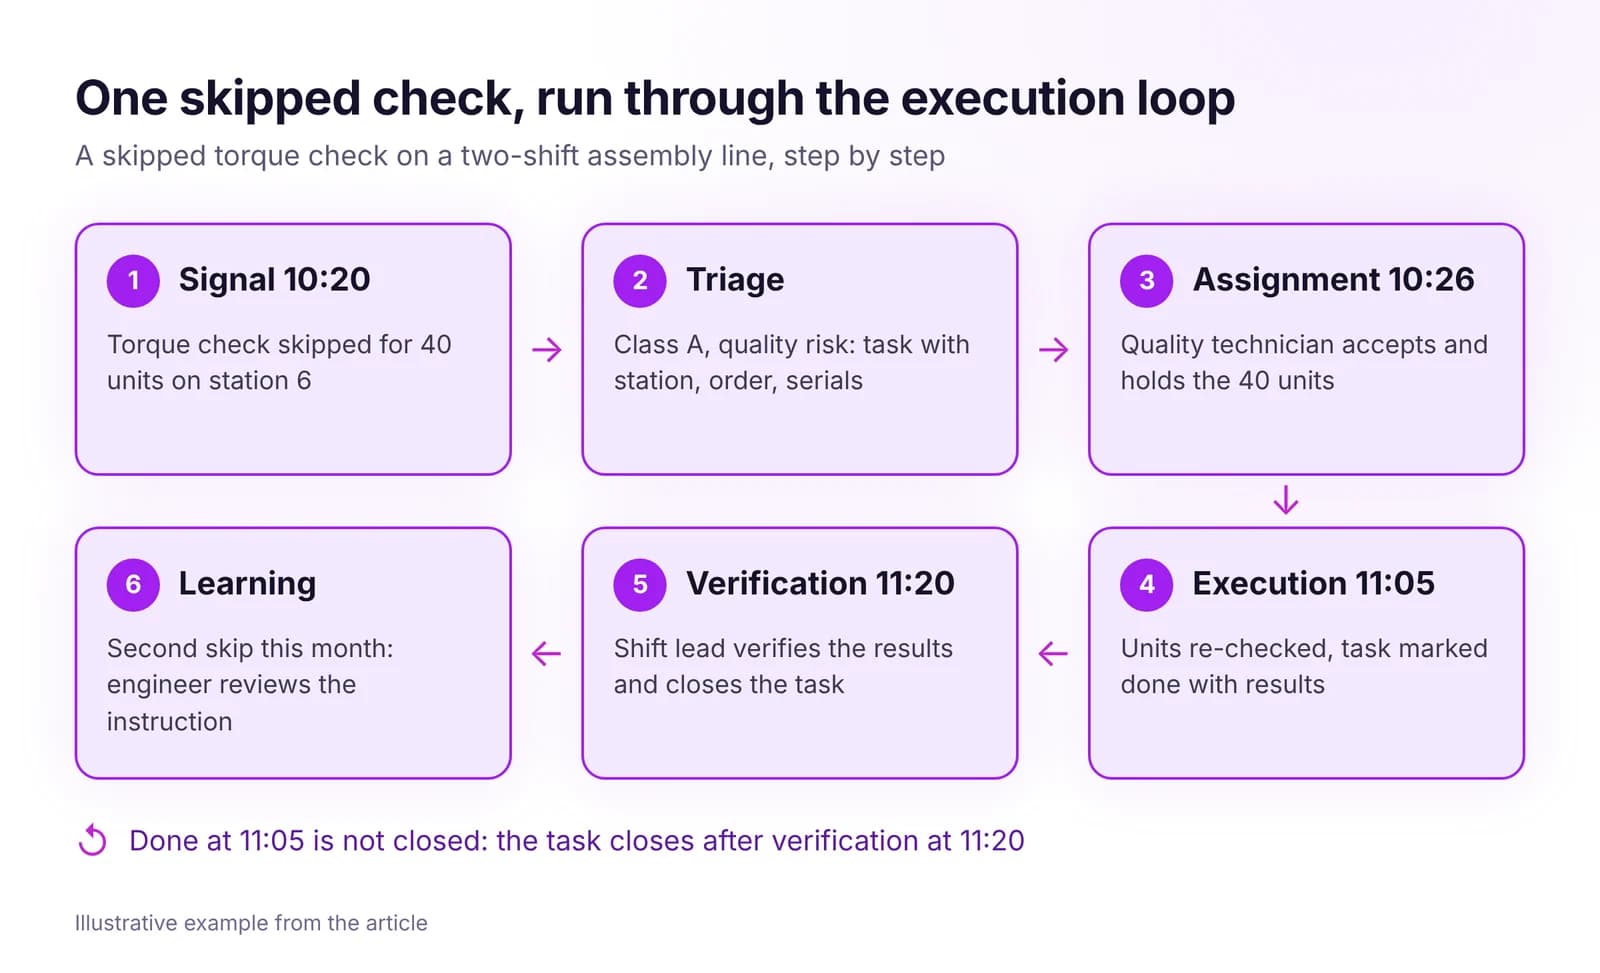 From Signal to Task to Closure: How the Execution Loop WorksHow a shop floor signal becomes a task with one owner, a deadline and a verified result. The seven steps of the execution loop and how to measure it.Read article · 7 min
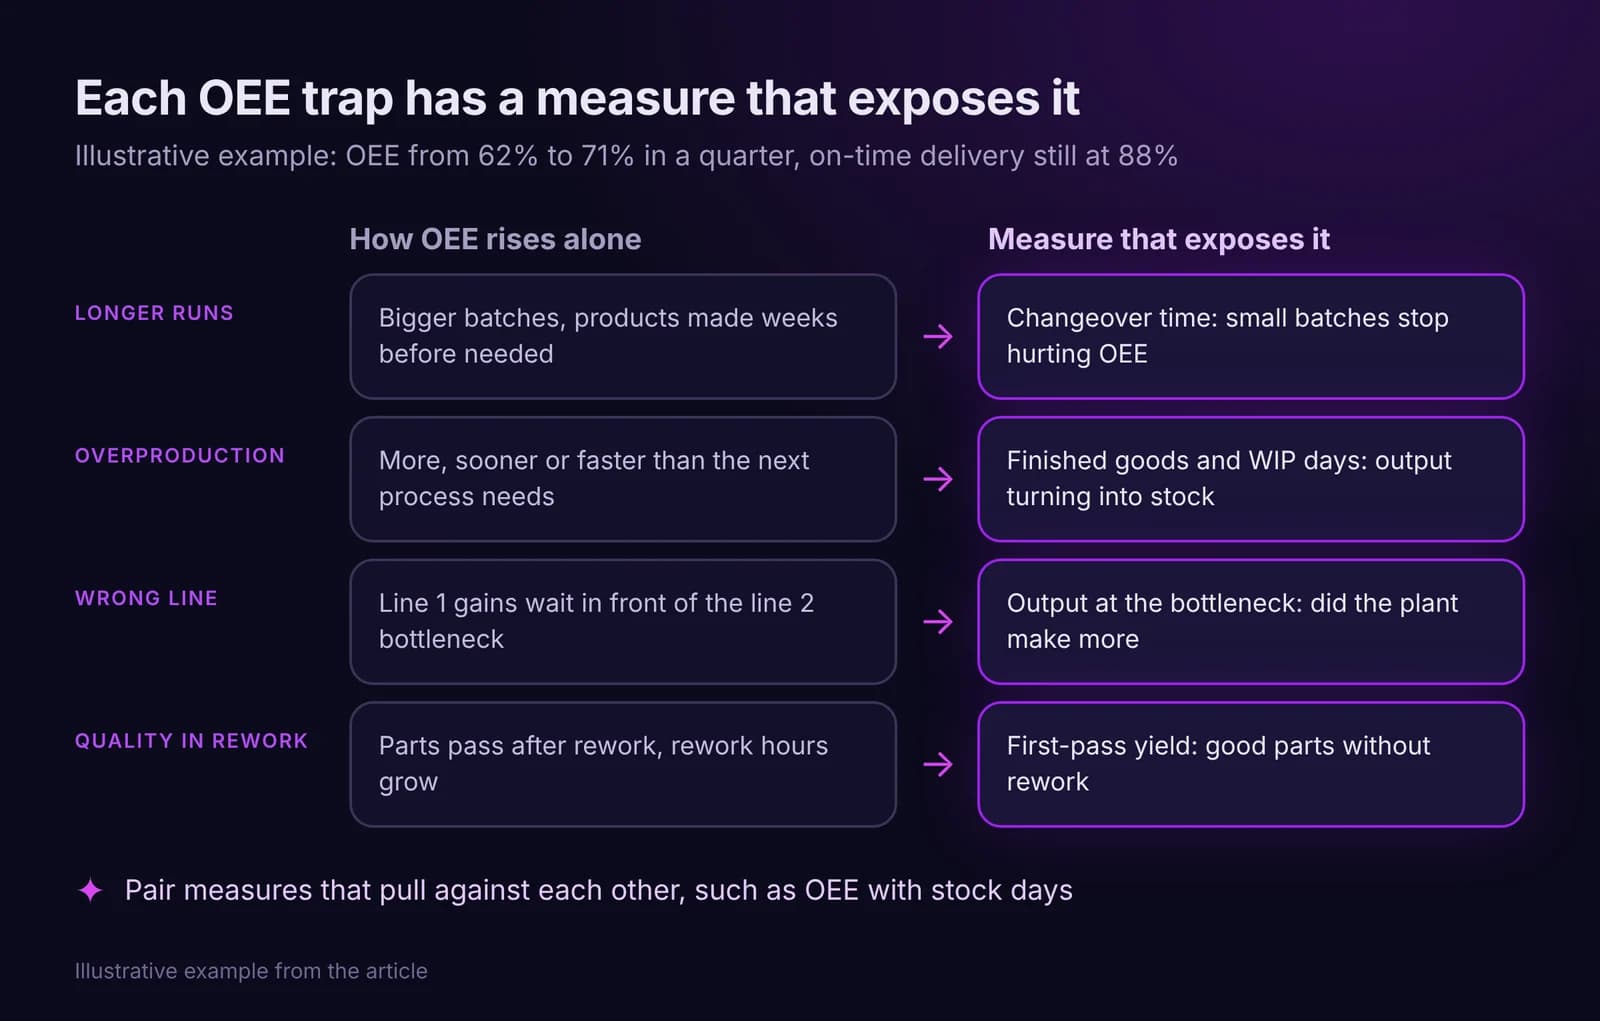
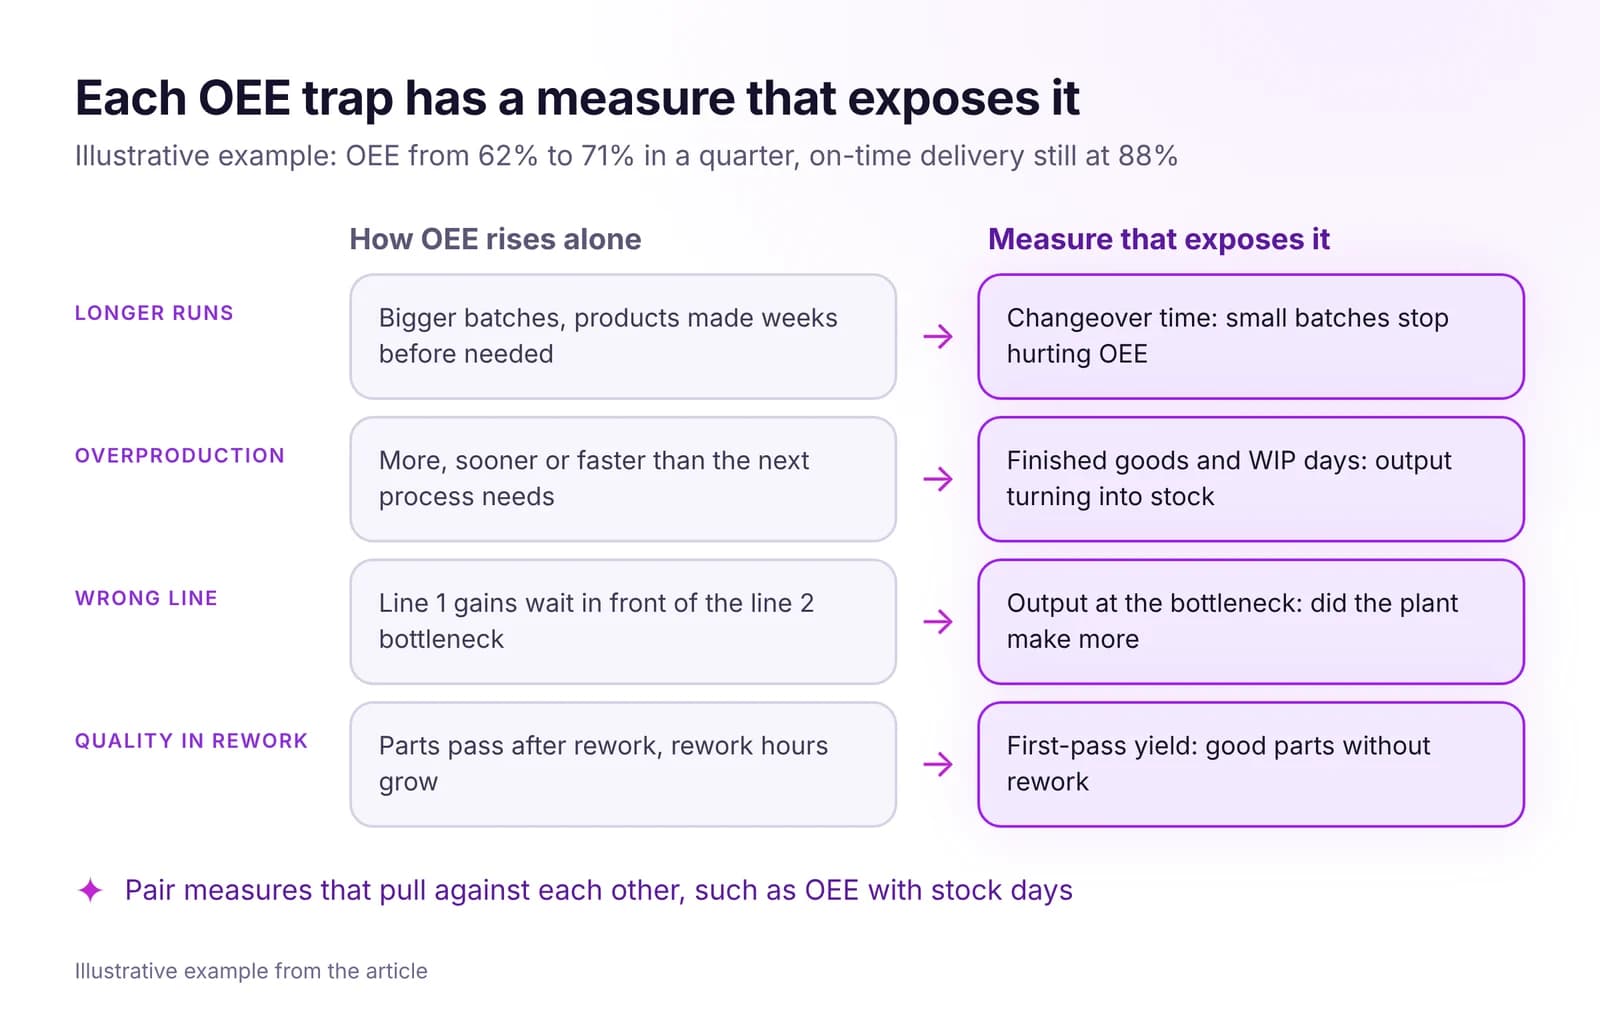 OEE Is Not Enough: What to Measure Instead of OEE AloneOEE can rise while delivery slips and stock grows. Five reasons why, the measures to put next to OEE, and how to build a short plant scorecard that holds up.Read article · 7 min
Try Lean Management System in IRIS
Start a 14-day trial on your plant's data, or open the interactive demo with sample data.