All modulesExample data
Data & Intelligence
Plant data for GRI and CDP reports
ESG collects emissions, energy, waste and water data for the plant and builds GRI and CDP reports from it.
IRISESG · DashboardOct 2026Oct
- Emissions
- 38t
- Energy
- 112MWh
- Waste
- 9t
- Water
- 640m3
Emissions by month (t CO2e)
JunJulAugSepOct
Order PO-2318 closed
0.17 t CO2e- Energy
- 410 kWh
- Factor
- 0.415 kg/kWh
Calculated
Report · GRI · 2026
GRI reportBuilt from the plant's data.GeneratingPublished
Published
Emissions, energy, waste and water in one view.
What it does
- 01
Emissions with your factors
Scope 1, 2 and 3 entries use your own emission factor catalog. Each entry records source, period and method.
- 02
Energy, waste and water
Each register shows totals. Energy converts to kWh, and entries in unknown units are reported as skipped.
- 03
GRI and CDP reports
Pick a standard and a period. The report is built from your data, and Published appears once the document exists.
Where the data comes from
- IoT energy meters post consumption for the real period between readings.
- Completed MES orders become calculated emissions from energy use and the valid factor.
- Closed HSE environmental incidents with a quantity and a factor add scope 1 emissions.
Good to know
- Reports are generated for GRI and CDP only. SASB, TCFD and CSRD/ESRS are not supported.
- Without an emission factor catalog, nothing is calculated automatically from production.
- Emission intensity is not calculated, and scope 2 is one figure without location-based and market-based values.
Screens from the IRIS demo
Sample data from the IRIS demo factory. Click a screen to enlarge it.
Read more
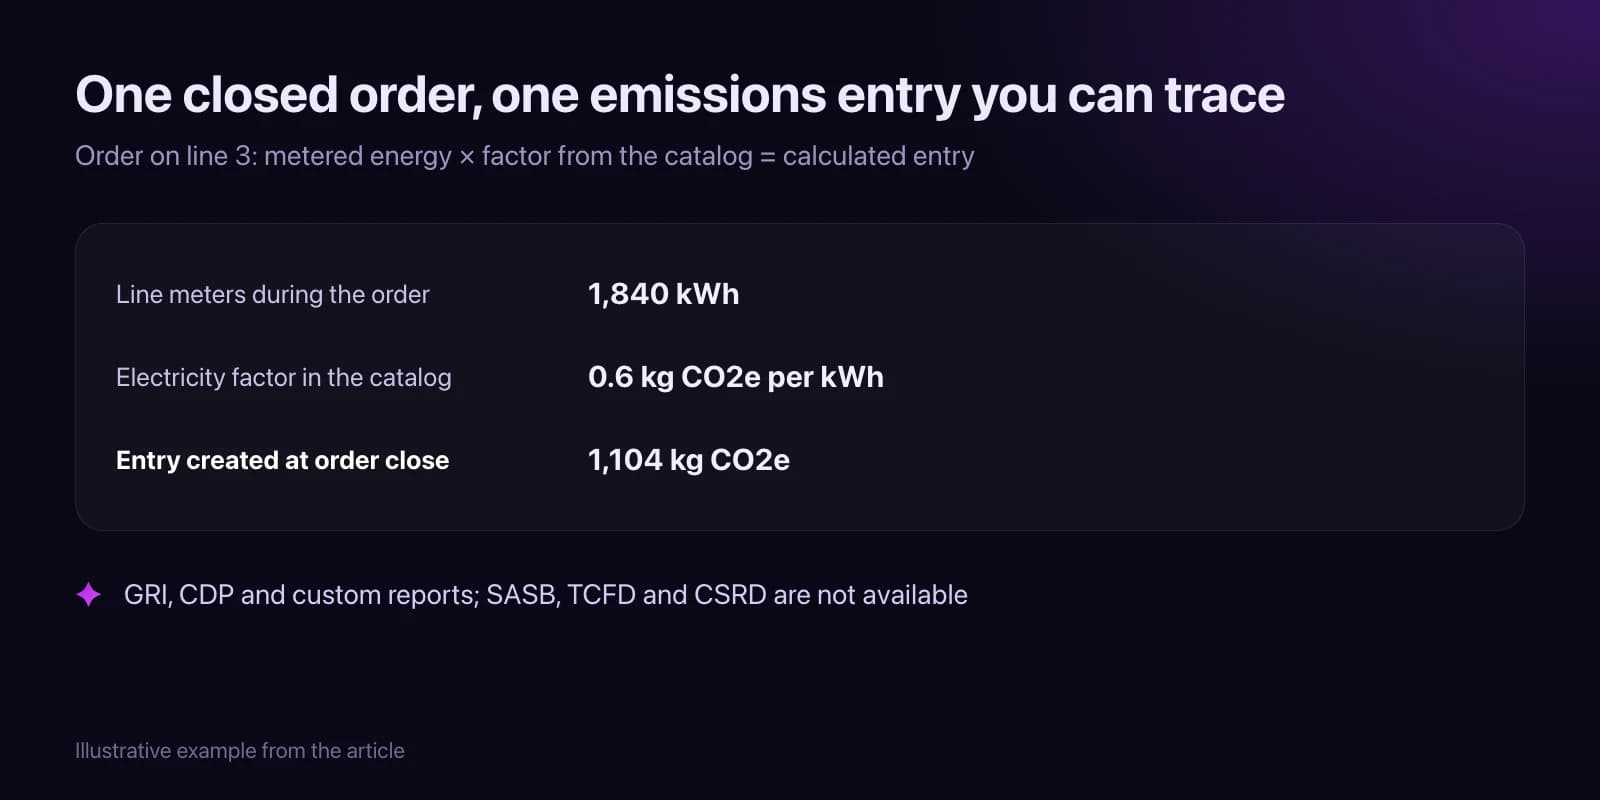
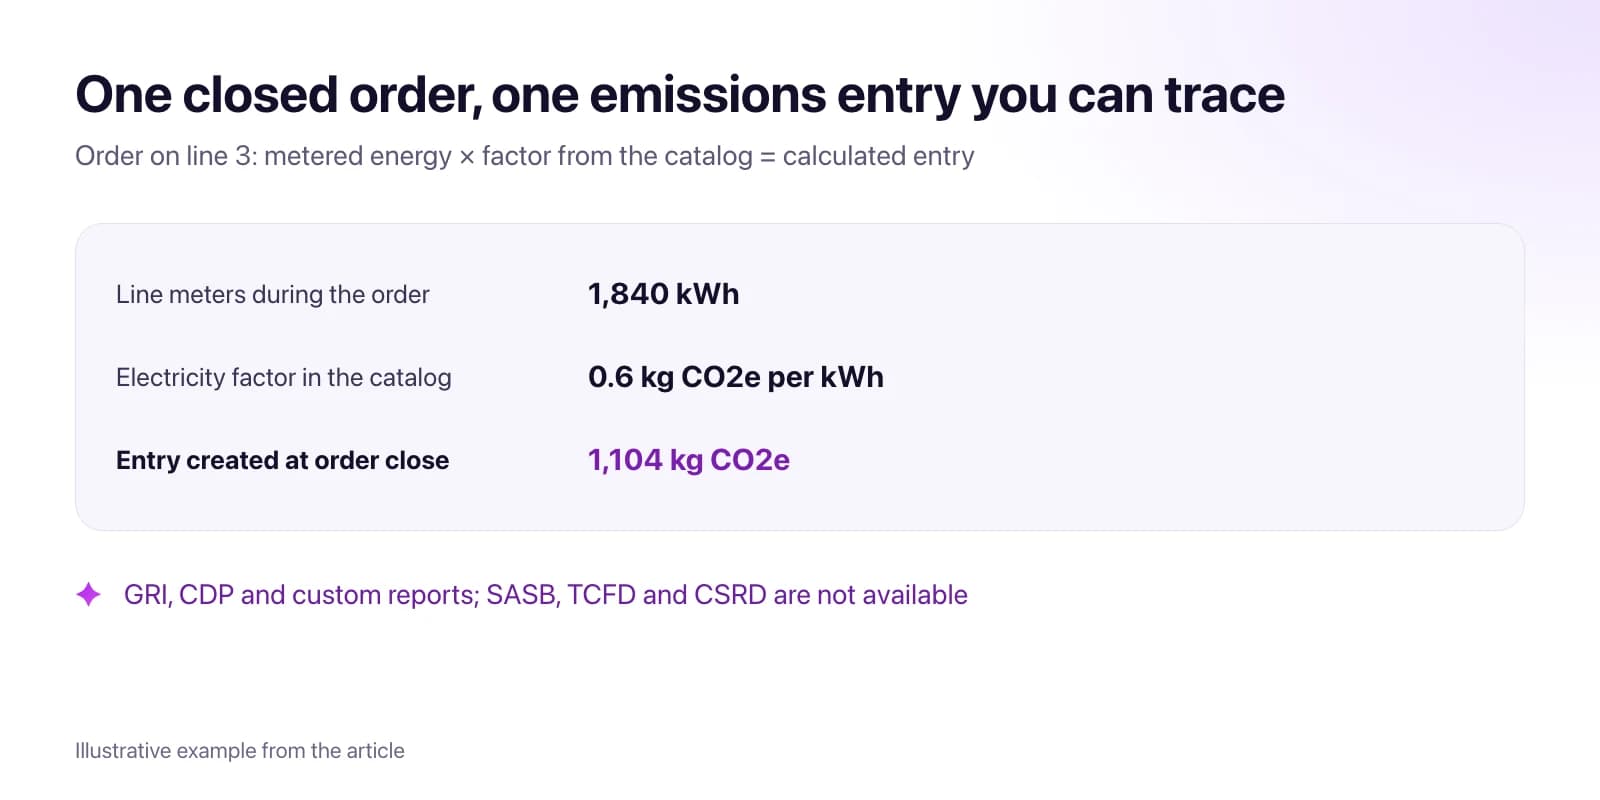 How to Build GRI and CDP Emissions Reporting From Your Plant's Own DataWhat GRI 305 and CDP ask a plant for, where each number comes from, four steps to keep it ready, and what IRIS ESG covers. No SASB, TCFD or CSRD support.Read article · 9 min
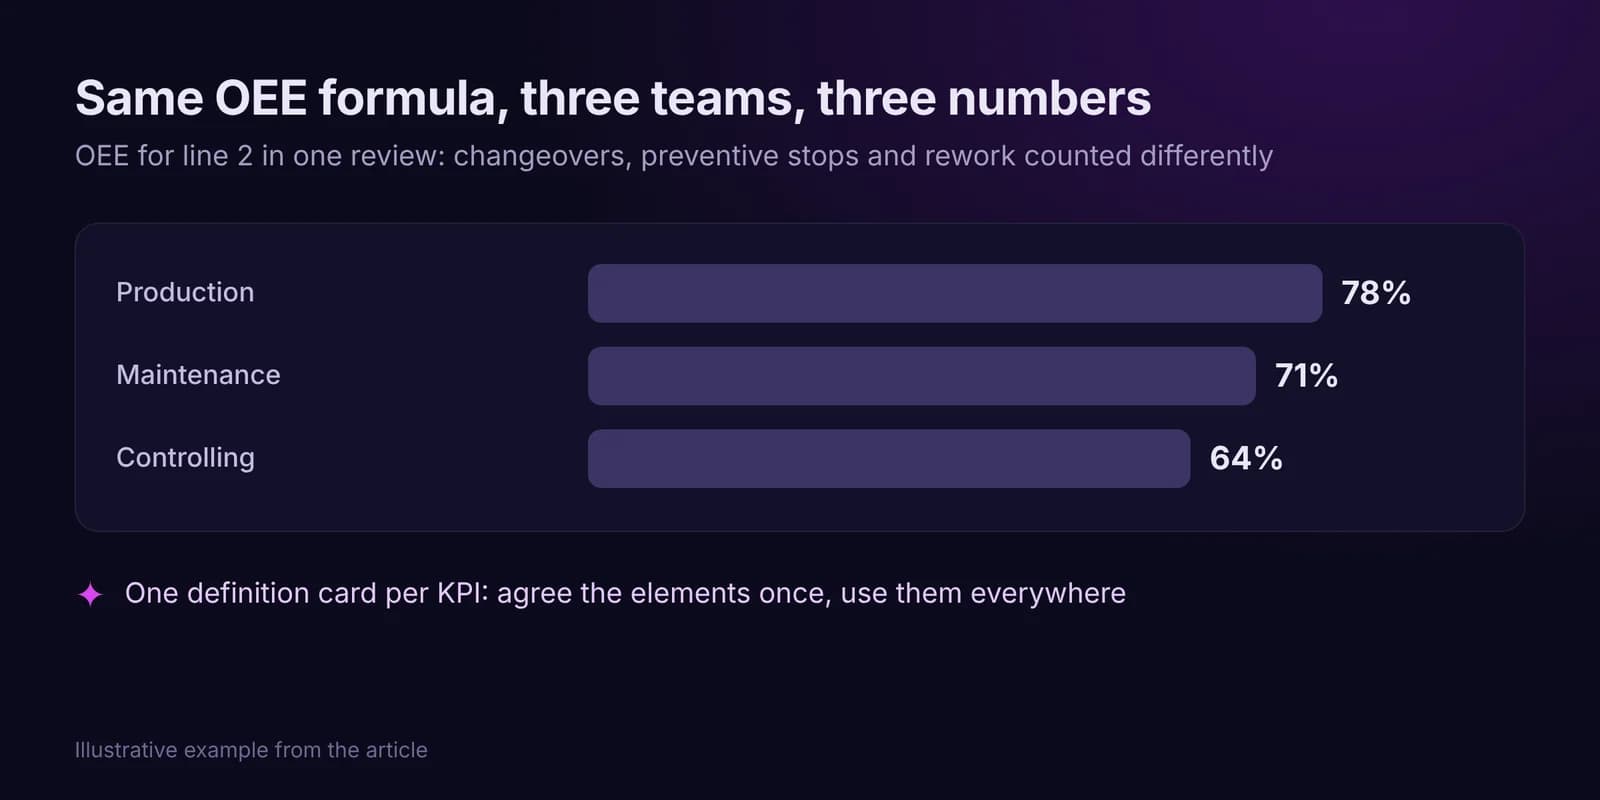
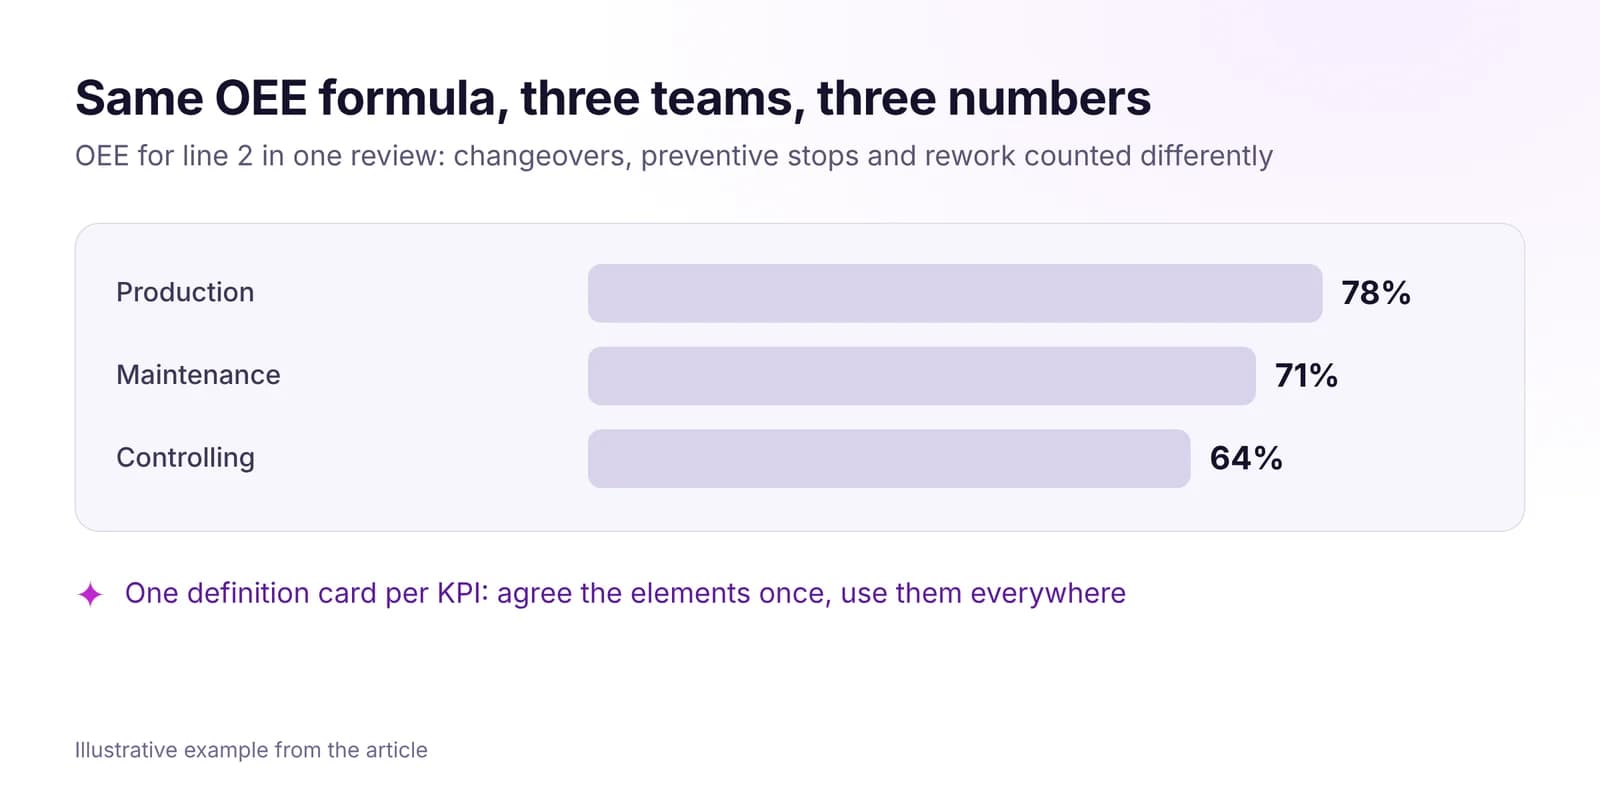 How to Build a Real-Time KPI System for Your FactoryGive every factory KPI one definition, one data source, one owner and one view. A four-step method based on ISO 22400, with an OEE definition card example.Read article · 7 min
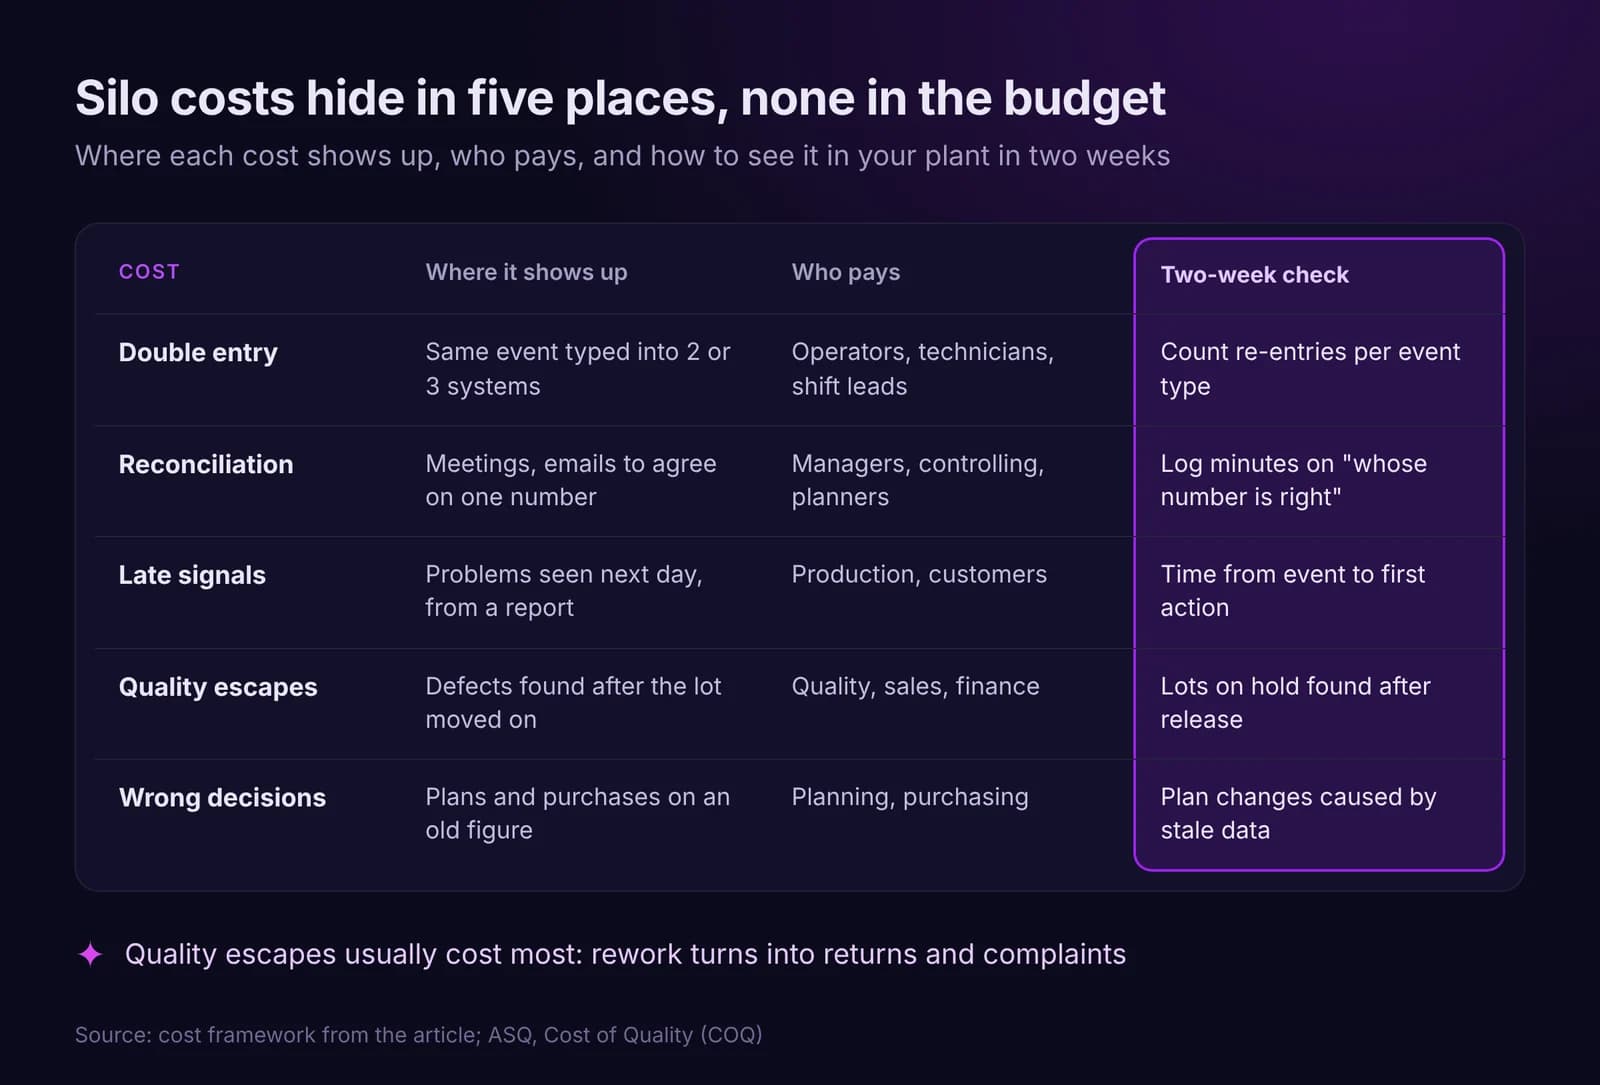
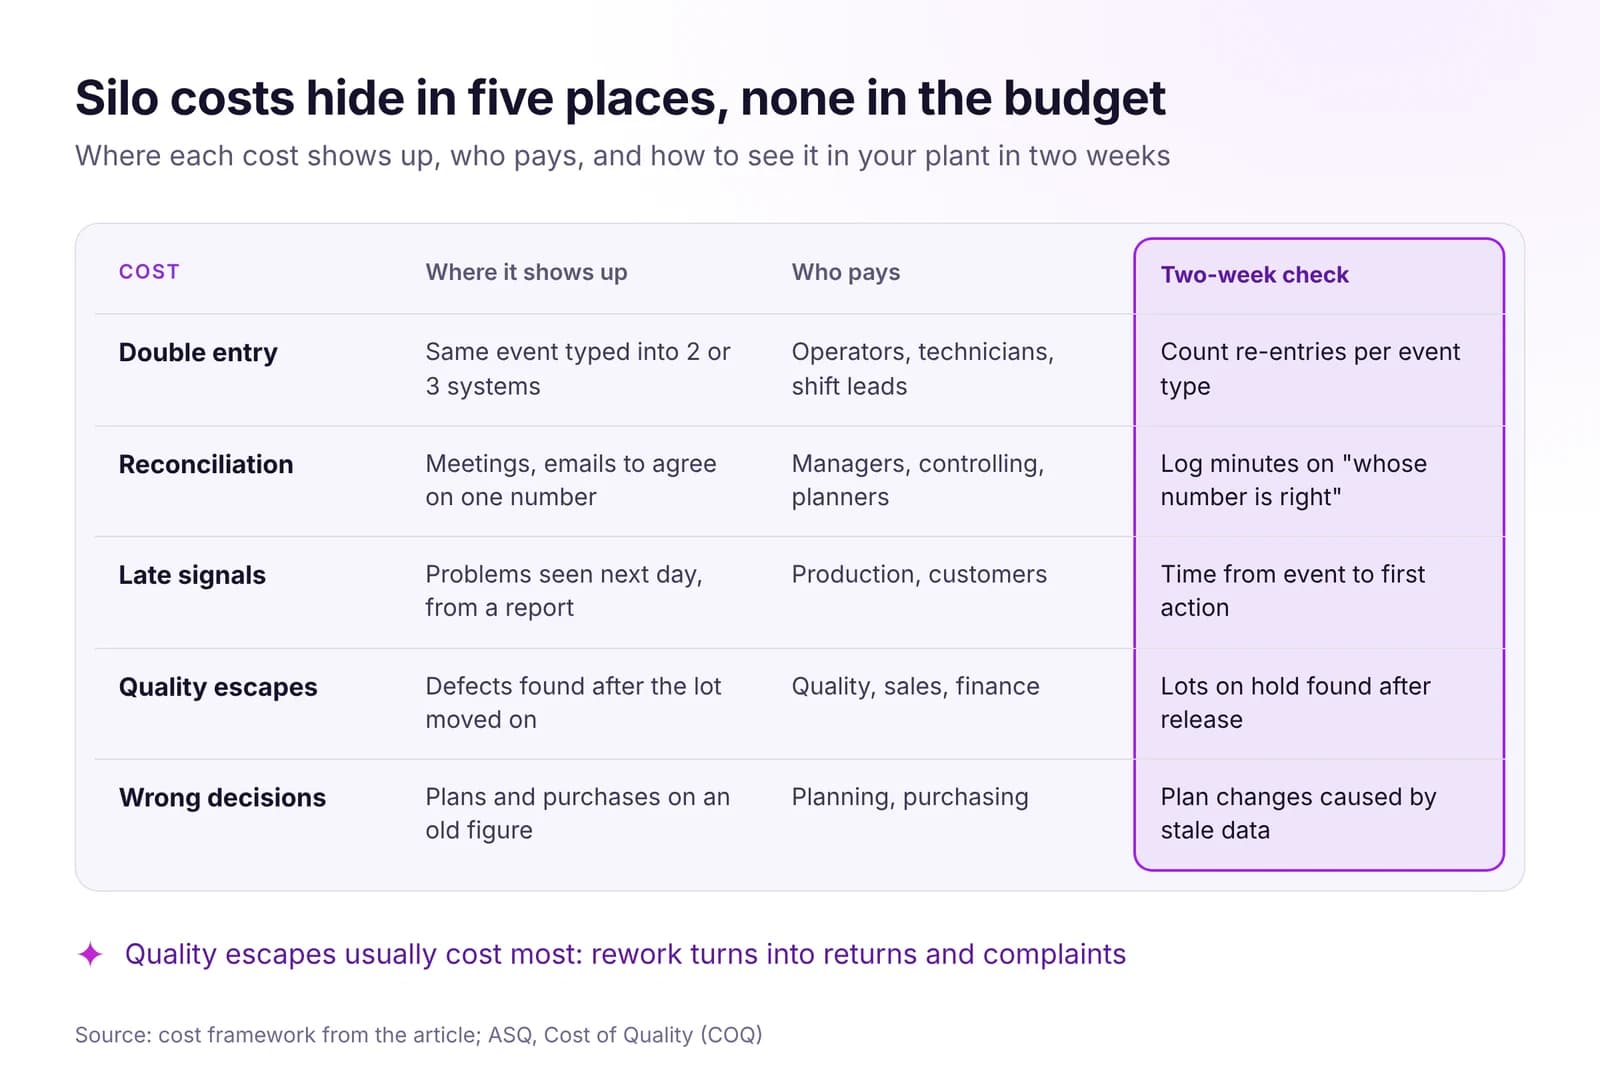 The Real Cost of Siloed Systems and Spreadsheets in a PlantSiloed tools and spreadsheets cost a plant in retyping, reconciling, late signals and quality escapes. Where the cost hides and how to measure it in two weeks.Read article · 7 min
Try ESG in IRIS
Start a 14-day trial on your plant's data, or open the interactive demo with sample data.