Producción y calidad
Órdenes de producción, de la liberación al cierre
Los operarios registran producción, paradas y defectos en un quiosco. MES Production los convierte en OEE y en un relevo que confirma el turno siguiente.
- Buenas
- 1146
- Desecho
- 0
- Parada
- 0min
Registrada en el quiosco
Parada de 6 min- Disponibilidad
- 88%
- Rendimiento
- 92%
- Calidad
- 97%
- OEE
- 79%
La línea 1 ejecuta la orden PO-2318 en cuatro puestos.
Qué hace
- 01
Un quiosco en cada puesto
Los operarios entran con PIN o tarjeta RFID, inician y terminan órdenes, registran piezas y defectos y avisan de averías.
- 02
Mismo OEE en cada pantalla
El panel de producción, los informes y KPI / Analytics usan el mismo cálculo de disponibilidad, rendimiento y calidad.
- 03
Calidad y trazabilidad
Los gráficos SPC comparan cada medición con los límites de control. El árbol de genealogía rastrea cada unidad y lote.
Míralo en acción
El vídeo está narrado en inglés; hay subtítulos en el reproductor.
Transcripción (en inglés)
This is the MES Production dashboard in IRIS. At the top you see OEE right now, with availability, performance and quality. Next to it are the output, the orders running, the completed orders and the open downtime. Below is the process flow of your line. Each station shows its name and its live state. The legend names the states: running, idle, andon, planned stop and unplanned stop. Under the flow you find the production orders, with their status, quantity, produced quantity and progress. Recent activity lists the latest events, and the station passes show what each station produced. The downtime list shows downtime from every source. Register downtime adds a new one. Open Performance for the OEE dashboard. It shows the plant OEE right now and ranks the machines. That is enough to get started. Production, Orders and Quality and Traceability are in the same module, so look around there too.
Transcripción (en inglés)
How well does your line really run? Many plants find out at the end of the shift, from a downtime sheet. In IRIS MES Production, the dashboard shows OEE right now, with availability, performance and quality. Every station on the line is on the map with its live state, such as running, idle or stopped. Downtime appears as it happens, with the station and how long it lasts. Machine signals come in through Data Bridge, and IoT shows OEE for each machine. No spreadsheet. No waiting for the end of the shift. Try the free demo at iris.dbr77.com.
De dónde vienen los datos
- El quiosco del operario: piezas, defectos, pausas, averías y llamadas Andon.
- Planes publicados en APS y órdenes importadas desde archivos CSV o XLSX.
- Alarmas de máquina de IoT y Data Bridge; las críticas generan una alerta Andon.
Conviene saber
- Los planes vienen de APS. MES Production los ejecuta e informa del estado de las órdenes.
- Las máquinas se conectan mediante IoT y Data Bridge. MES Production no tiene enlace directo con PLC.
- Las instrucciones de trabajo y definiciones de proceso se escriben en Engineering. MES Production las ejecuta.
Pantallas de la demo de IRIS
Datos de ejemplo de la fábrica demo de IRIS. Haz clic en una pantalla para ampliarla.
Más información
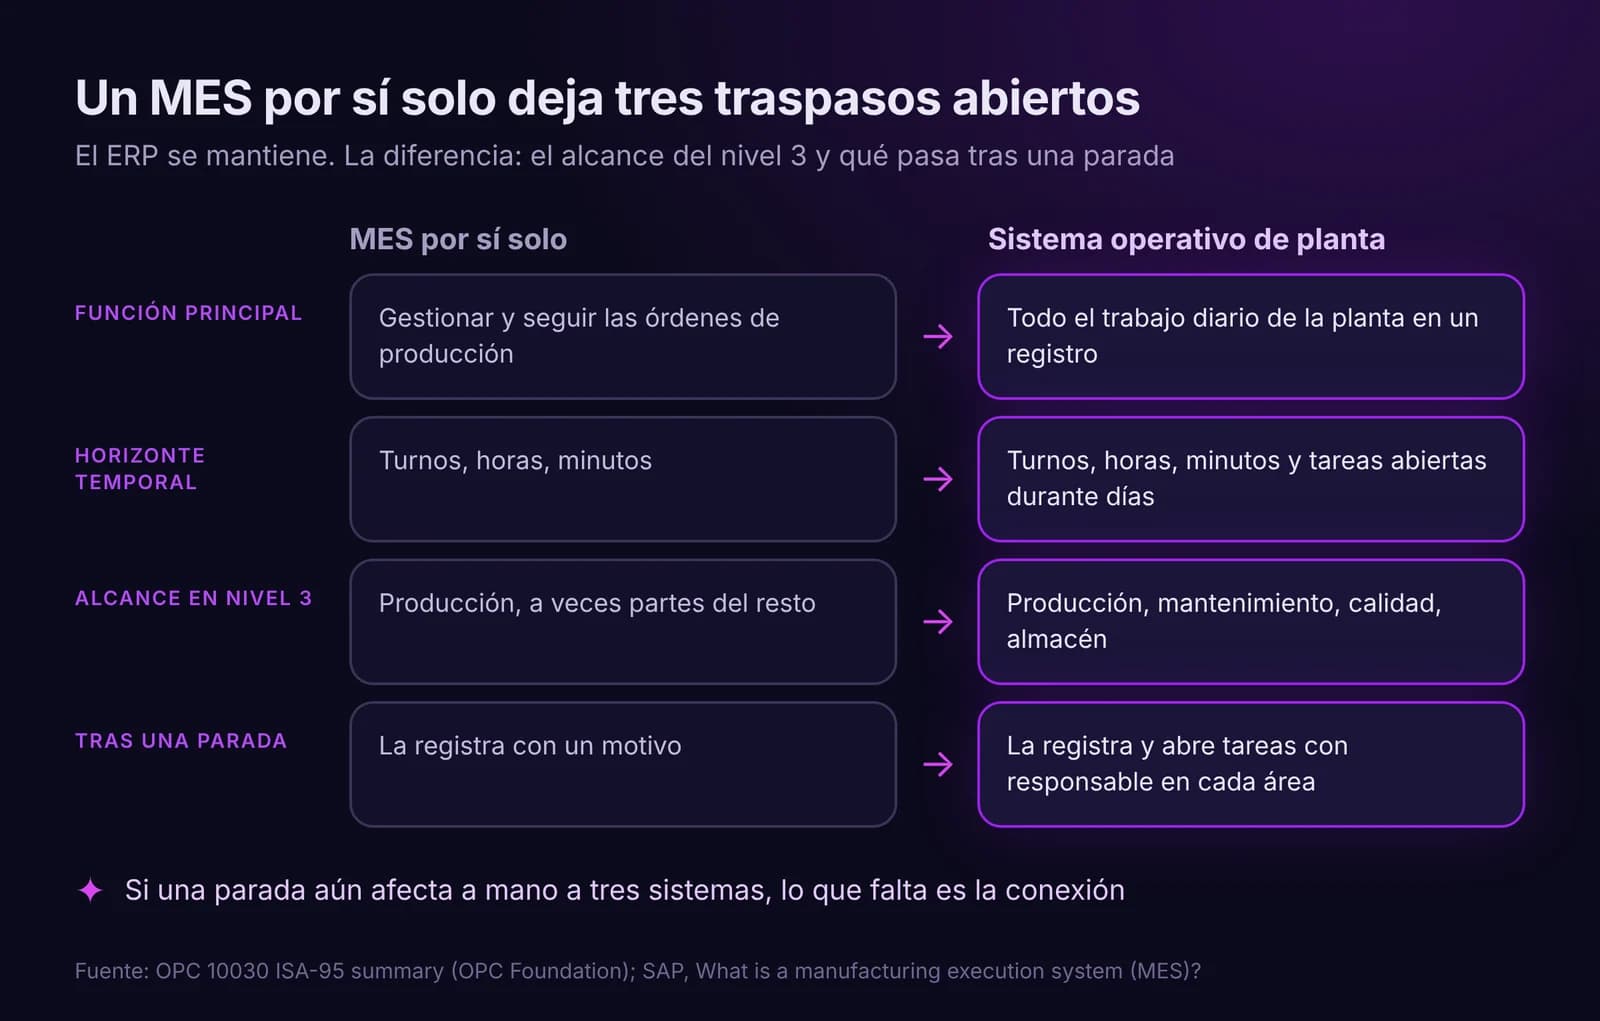
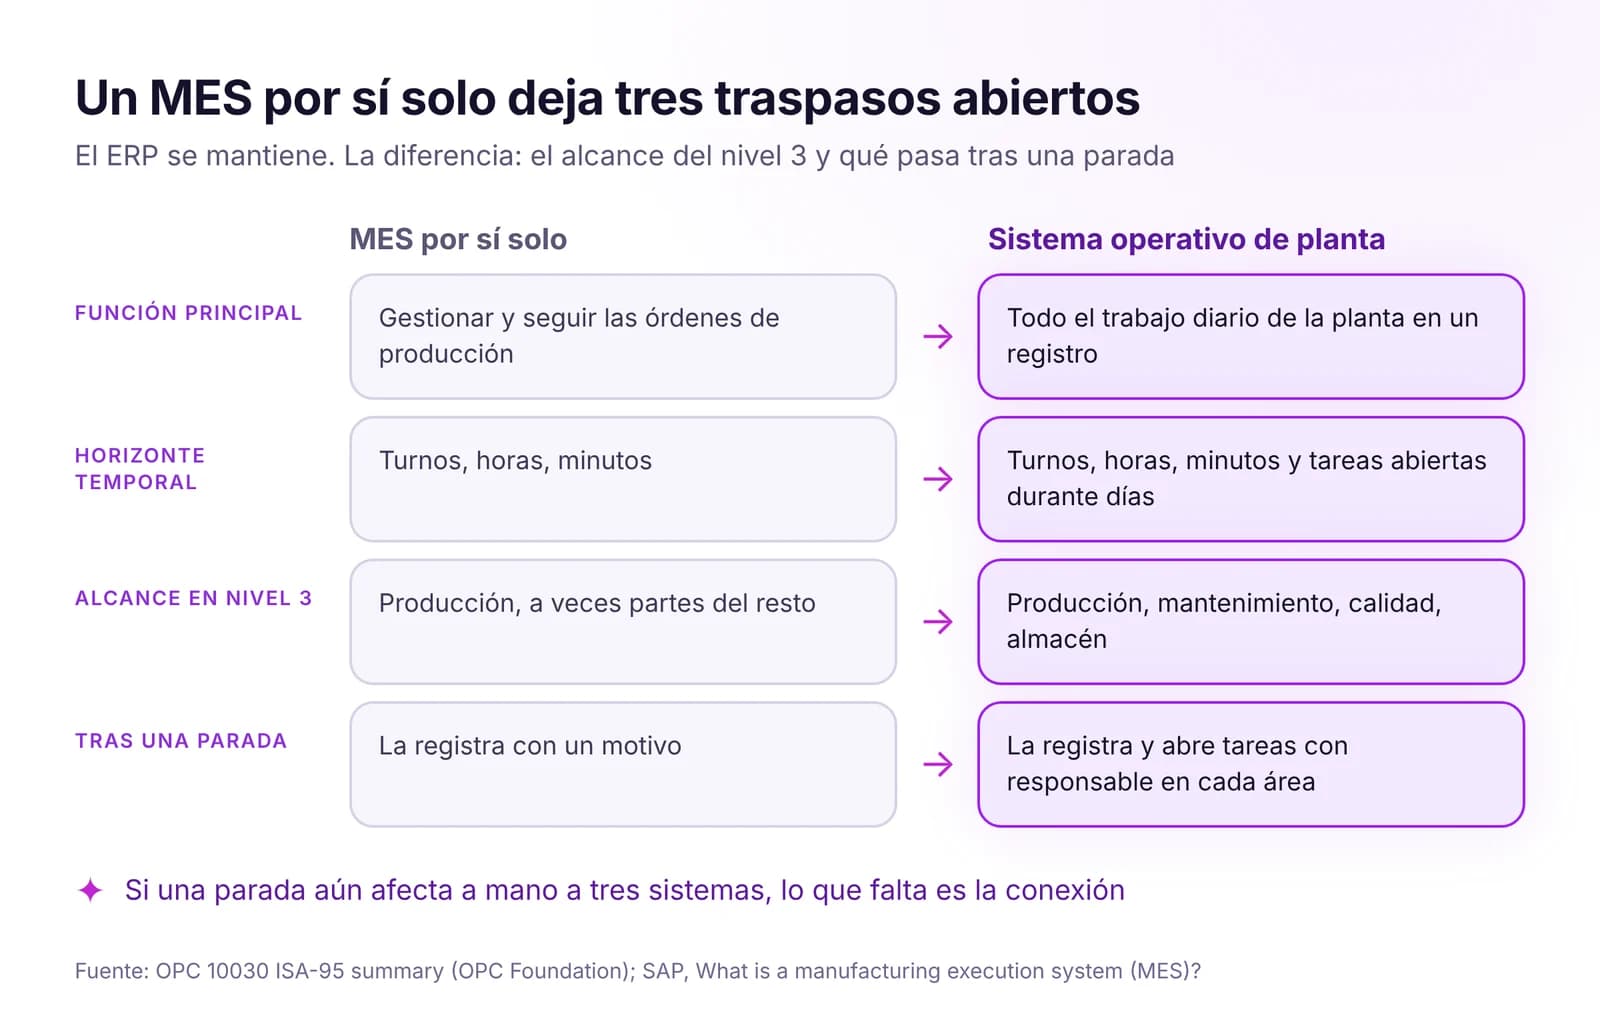 Sistema operativo de planta frente a MES y ERP: quién hace qué en una plantaEl ERP planifica el negocio, el MES ejecuta las órdenes y el sistema operativo de planta une todo el trabajo en un solo registro. Dónde se queda corto el MES.Leer artículo · 8 min
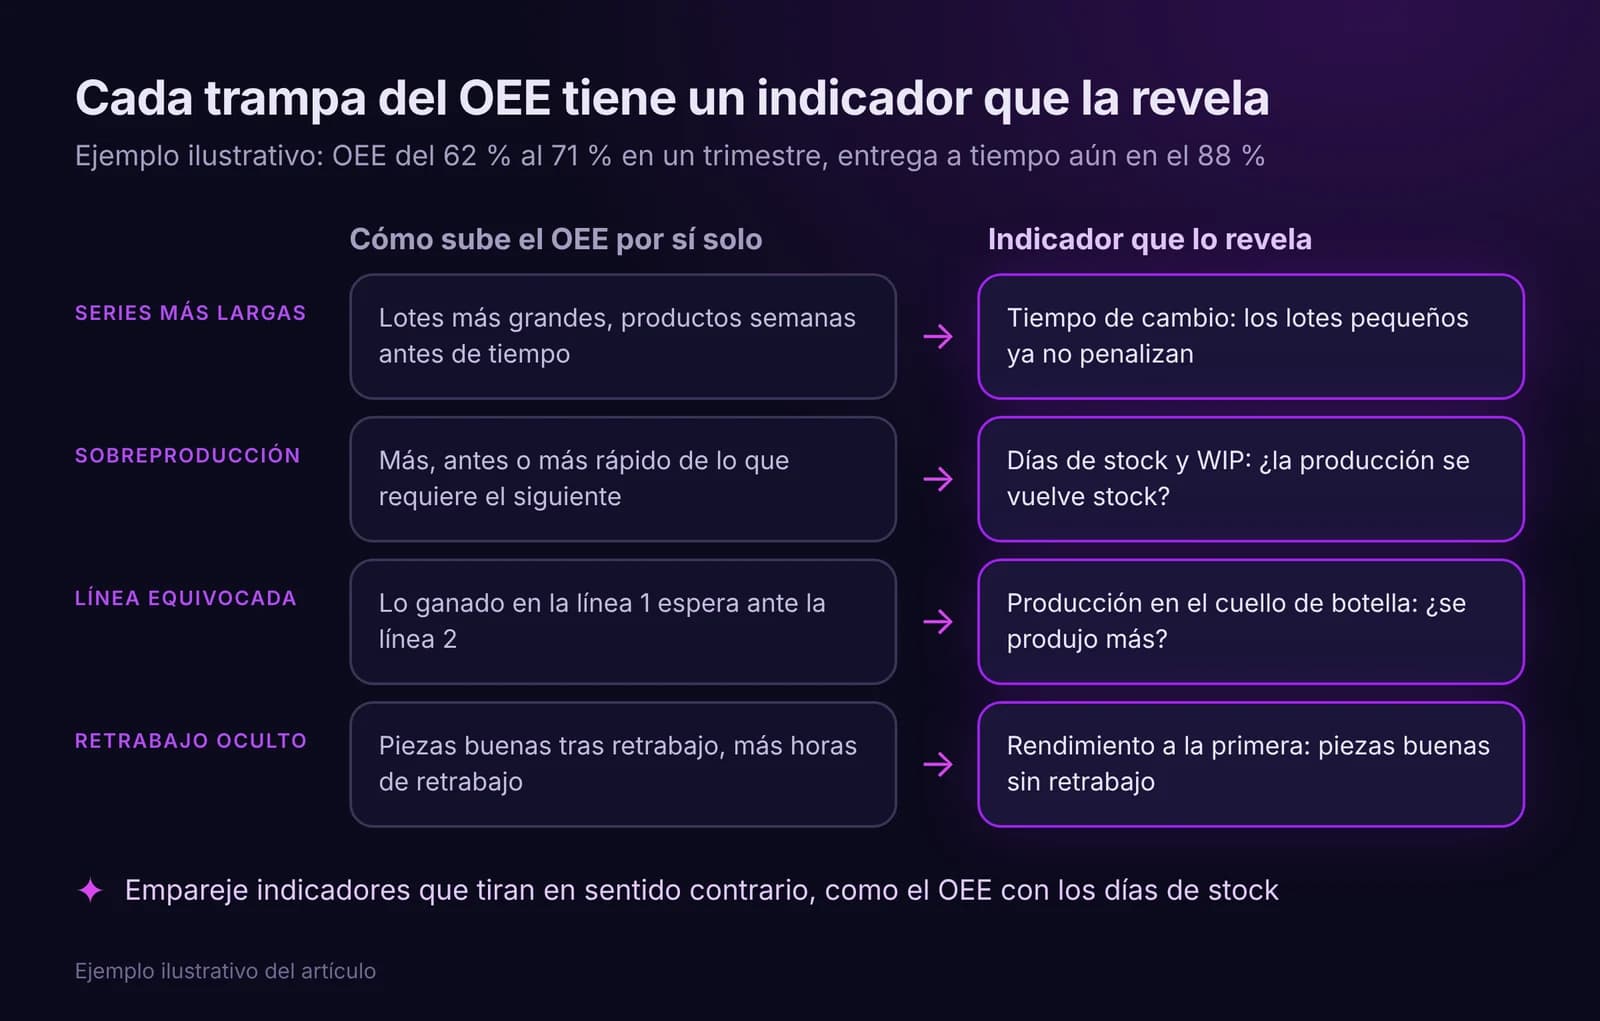
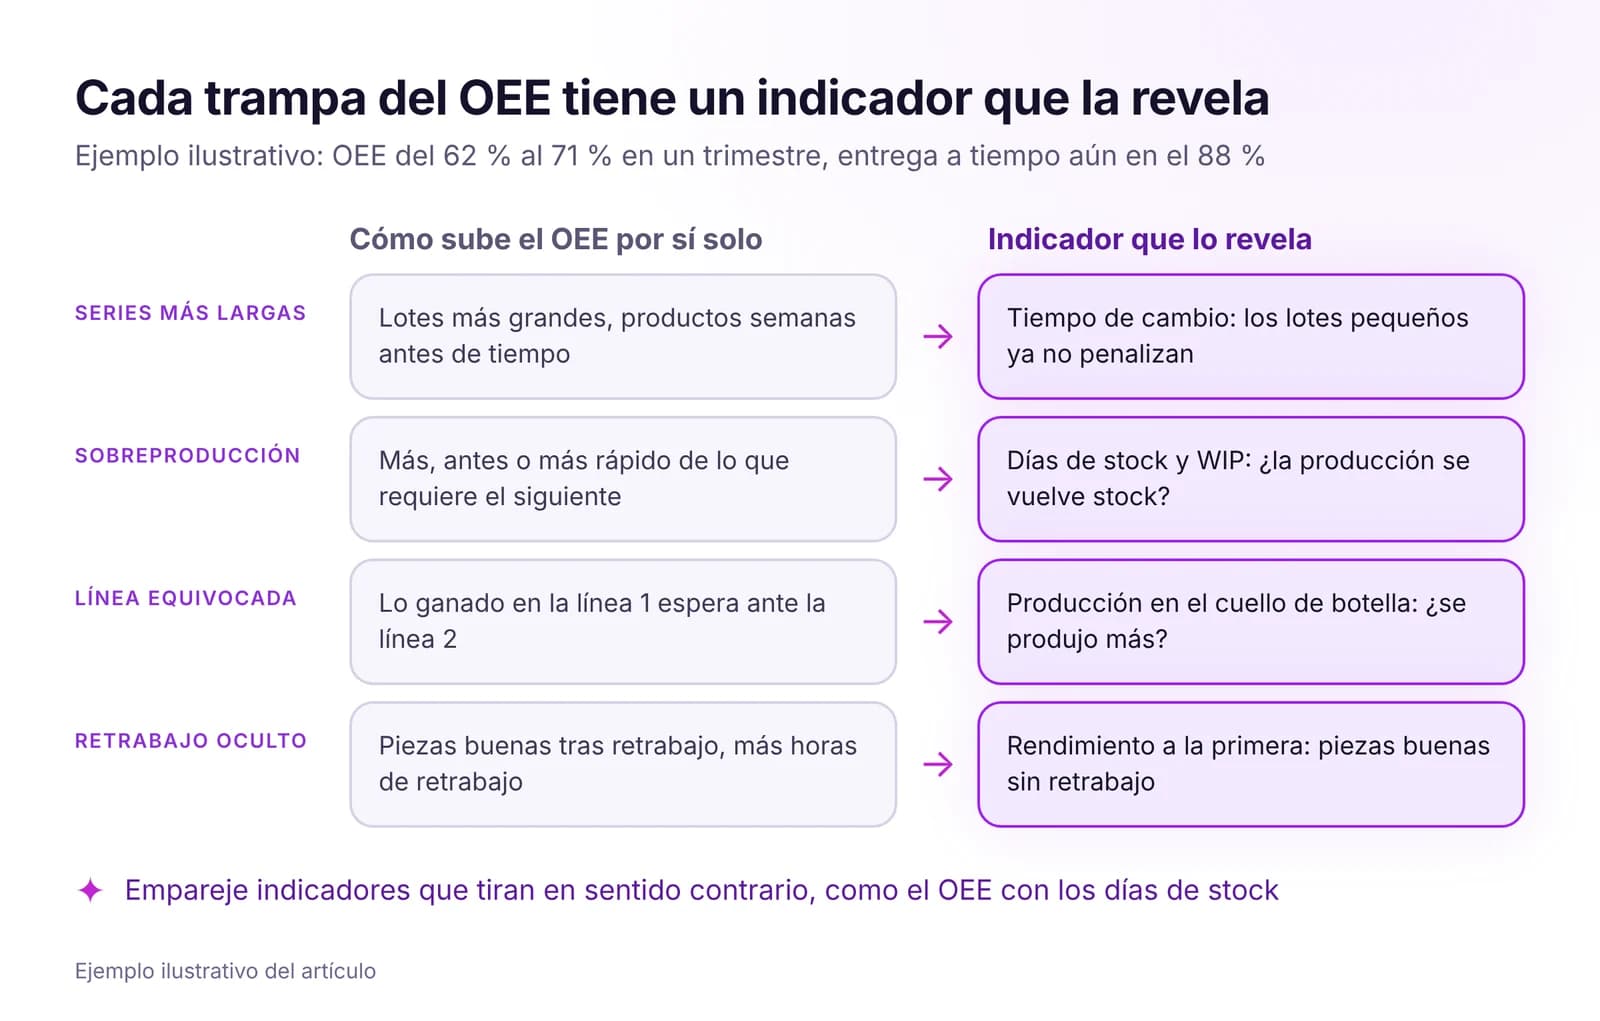 El OEE no basta: qué medir además del OEEEl OEE puede subir mientras caen las entregas a tiempo y crece el stock. Cinco razones, qué indicadores añadir y cómo crear un cuadro de mando breve de planta.Leer artículo · 8 min
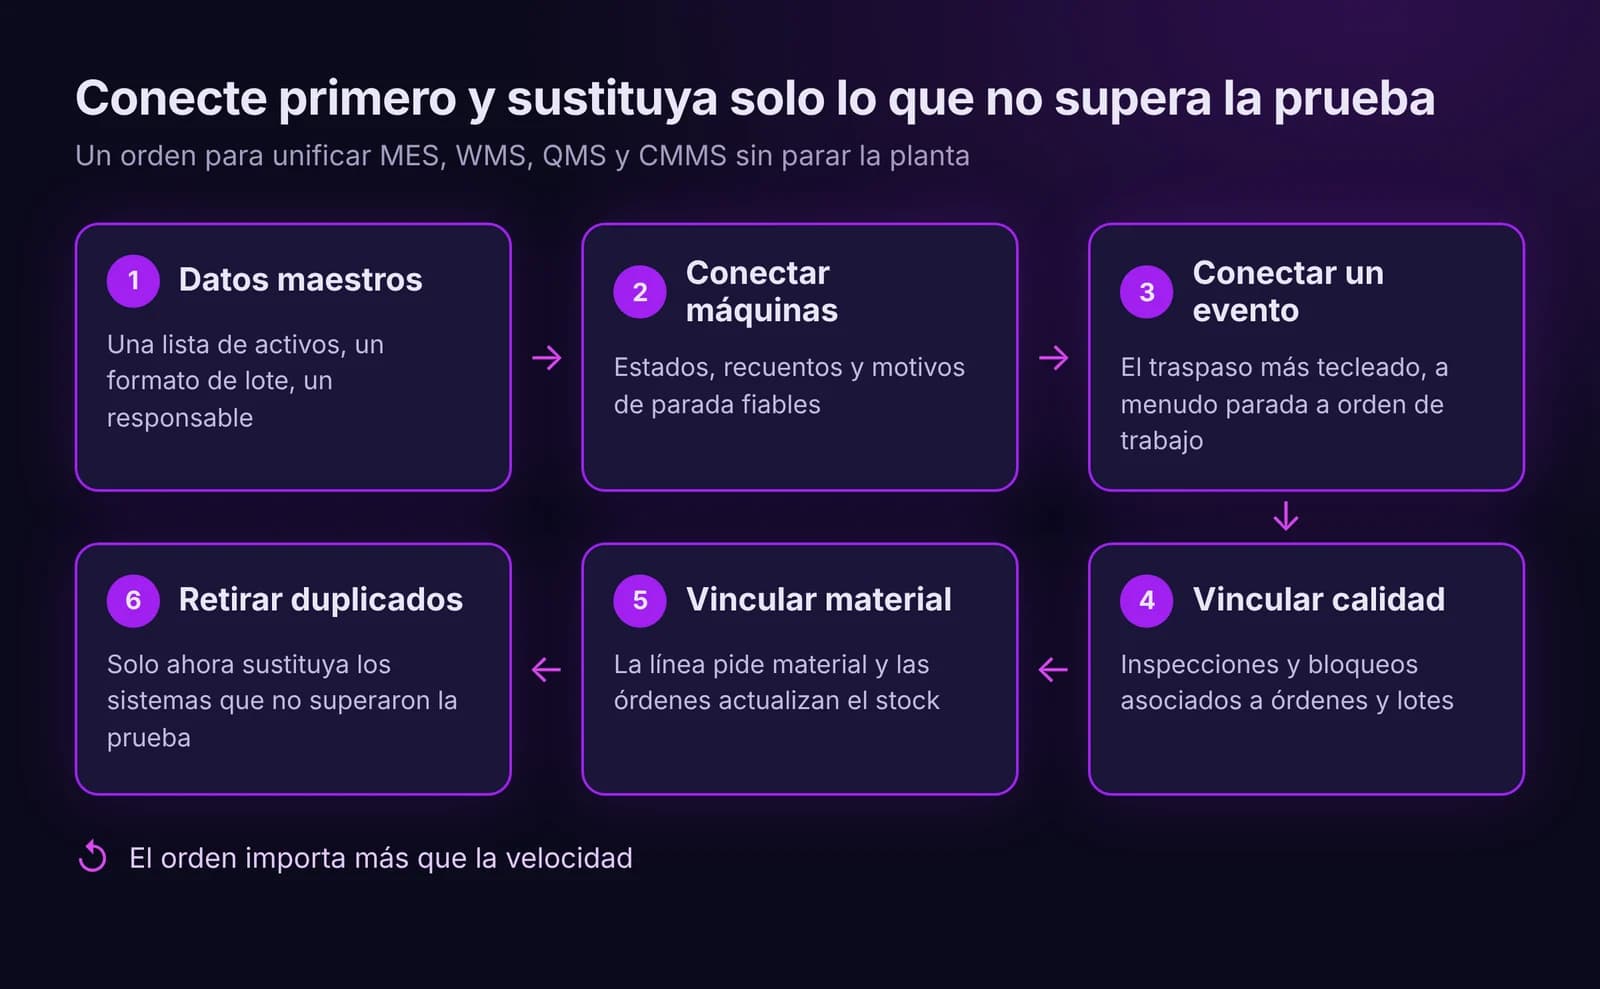
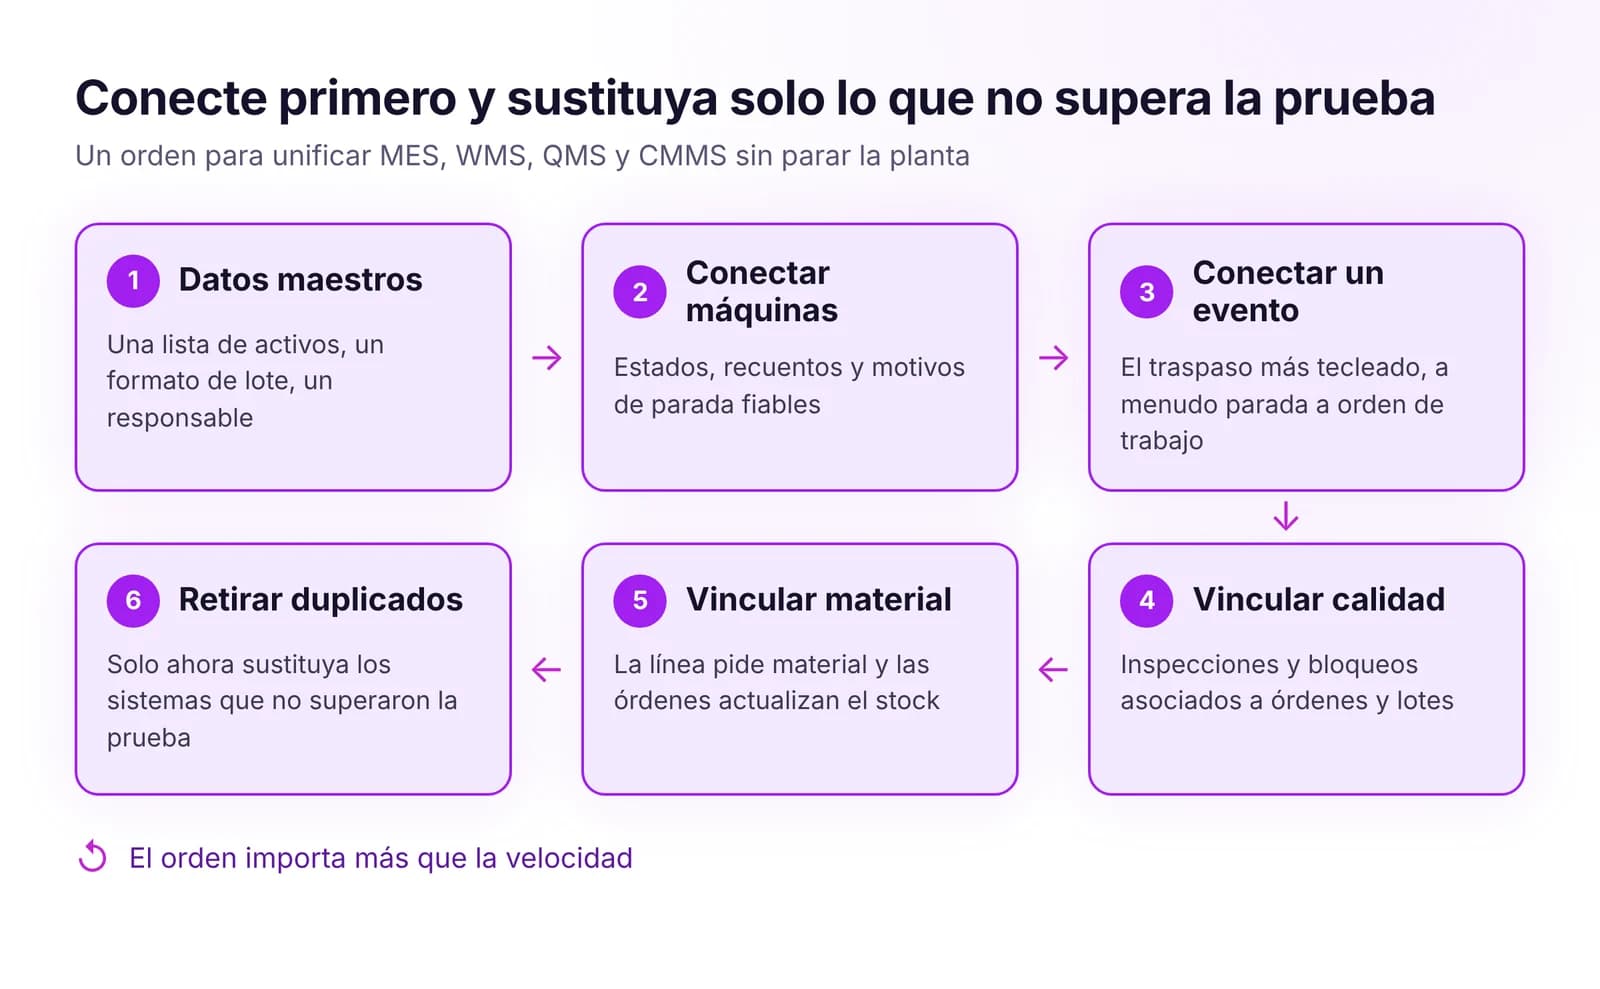 Cómo unificar MES, WMS, QMS y CMMS sin sustituirlo todoUnifique MES, WMS, QMS y CMMS sin un proyecto big bang: primero datos maestros comunes, luego los eventos clave, y sustituya solo el sistema que bloquea el flujo.Leer artículo · 8 min
Prueba MES Production en IRIS
Empieza la prueba de 14 días con datos de tu planta o abre la demo interactiva con datos de ejemplo.