データと分析
GRIとCDPのレポートに使う工場データ
ESGは工場の排出量、エネルギー、廃棄物、水のデータを集め、そこからGRIとCDPのレポートを作成します。
- 排出量
- 38t
- エネルギー
- 112MWh
- 廃棄物
- 9t
- 水
- 640m3
- エネルギー
- 410 kWh
- 係数
- 0.415 kg/kWh
排出量、エネルギー、廃棄物、水を1つの画面で。
主な機能
- 01
自社の係数で排出量を算定
スコープ1、2、3の記録には、自社の排出係数カタログを使います。各記録には排出源、期間、算定方法が残ります。
- 02
エネルギー、廃棄物、水
台帳ごとに合計を表示します。エネルギーはkWhに換算し、単位が不明な記録はスキップとして報告します。
- 03
GRIとCDPのレポート
基準と期間を選ぶと、自社のデータからレポートを作成します。文書ができた時点で「公開済み」と表示されます。
動作を見る
動画は英語のナレーションです。字幕はプレーヤーで利用できます。
文字起こし(英語)
This is the ESG dashboard in IRIS. The cards show emissions, energy, waste and water, then goals, permits and the compliance score. Emissions are split by scope, one, two and three. Further down you see the progress of your goals. Open Environmental to work with the emission records. Each record shows its source, scope, category, amount, method and period. You can filter by scope and export the list to Excel or CSV. Add Entry creates a new record. The tabs next to Emissions cover emission factors, energy, waste and water. Open Carbon to compare reduction scenarios, with levers such as renewable energy or heat pumps. That is enough to get started. Compliance, Social and Governance, Tracking and Evidence are in the same module, so look around there too.
文字起こし(英語)
Who works your shifts, how safe is the plant, and what does it emit? Too often each answer sits in a different tool. IRIS keeps all three on the same plant data. People shows your employees, departments, positions and shifts. HSE tracks incidents and risk assessments, with a five by five risk matrix. ESG tracks emissions by scope, your goals and carbon reduction scenarios. People, safety and sustainability, in one place. Try the free demo at iris.dbr77.com.
データの取得元
- IoTのエネルギーメーターが、前回と今回の計測の間の実際の期間について消費量を記録します。
- 完了したMESのオーダーから、エネルギー使用量と有効な係数で排出量を計算します。
- 安全衛生でクローズした環境インシデントのうち、数量と係数があるものはスコープ1の排出量に加わります。
補足
- レポートを作成できるのはGRIとCDPだけです。SASB、TCFD、CSRD/ESRSには対応していません。
- 排出係数カタログがない場合、生産データからの自動計算は行われません。
- 排出原単位は計算しません。スコープ2は1つの数値で、ロケーション基準とマーケット基準の値は分けていません。
IRISデモの画面
IRISデモ工場のサンプルデータです。画面をクリックすると拡大します。
関連記事
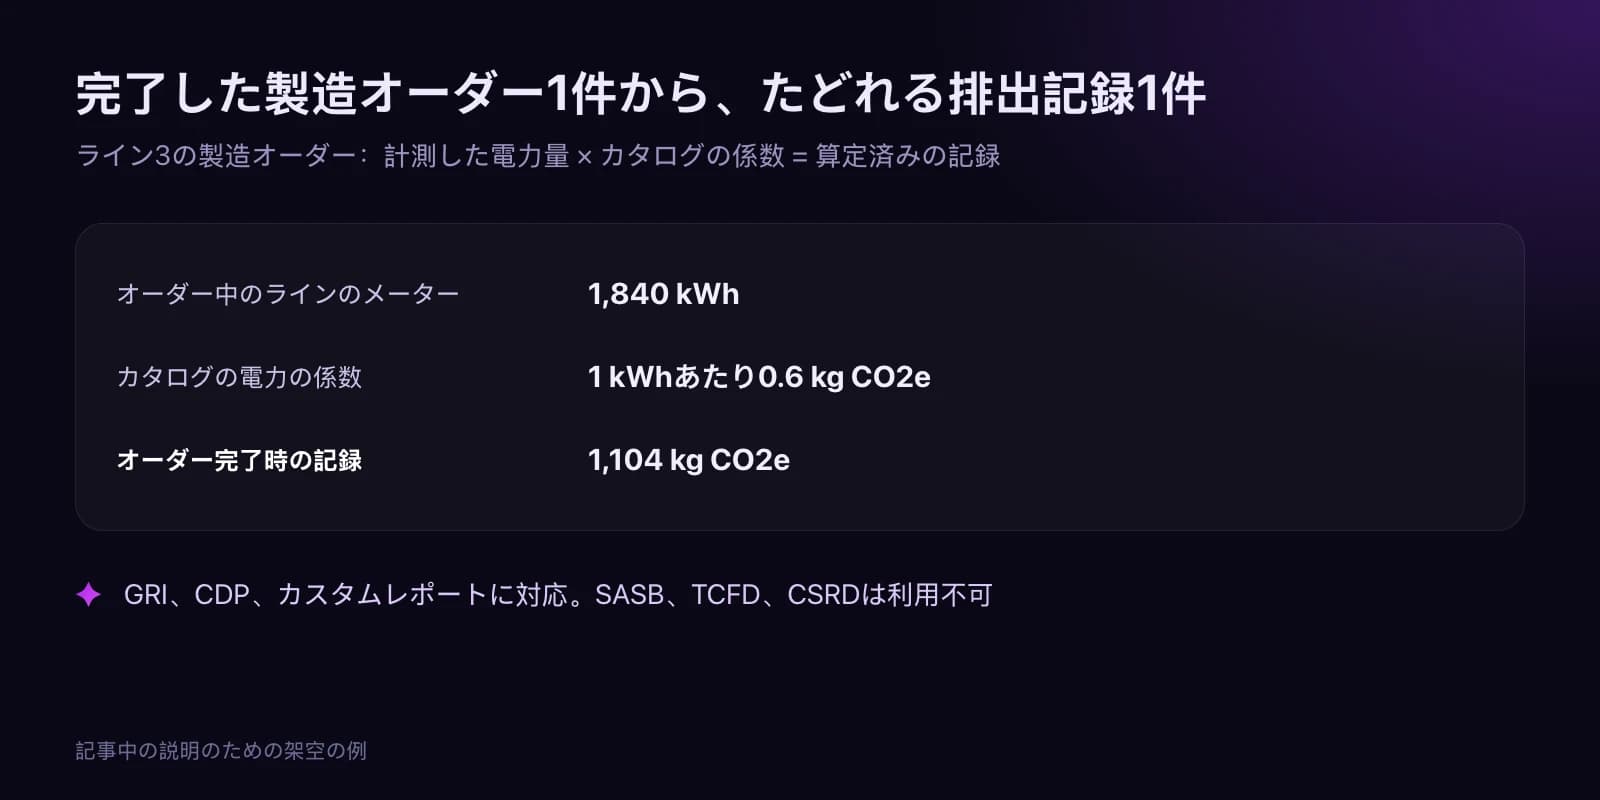
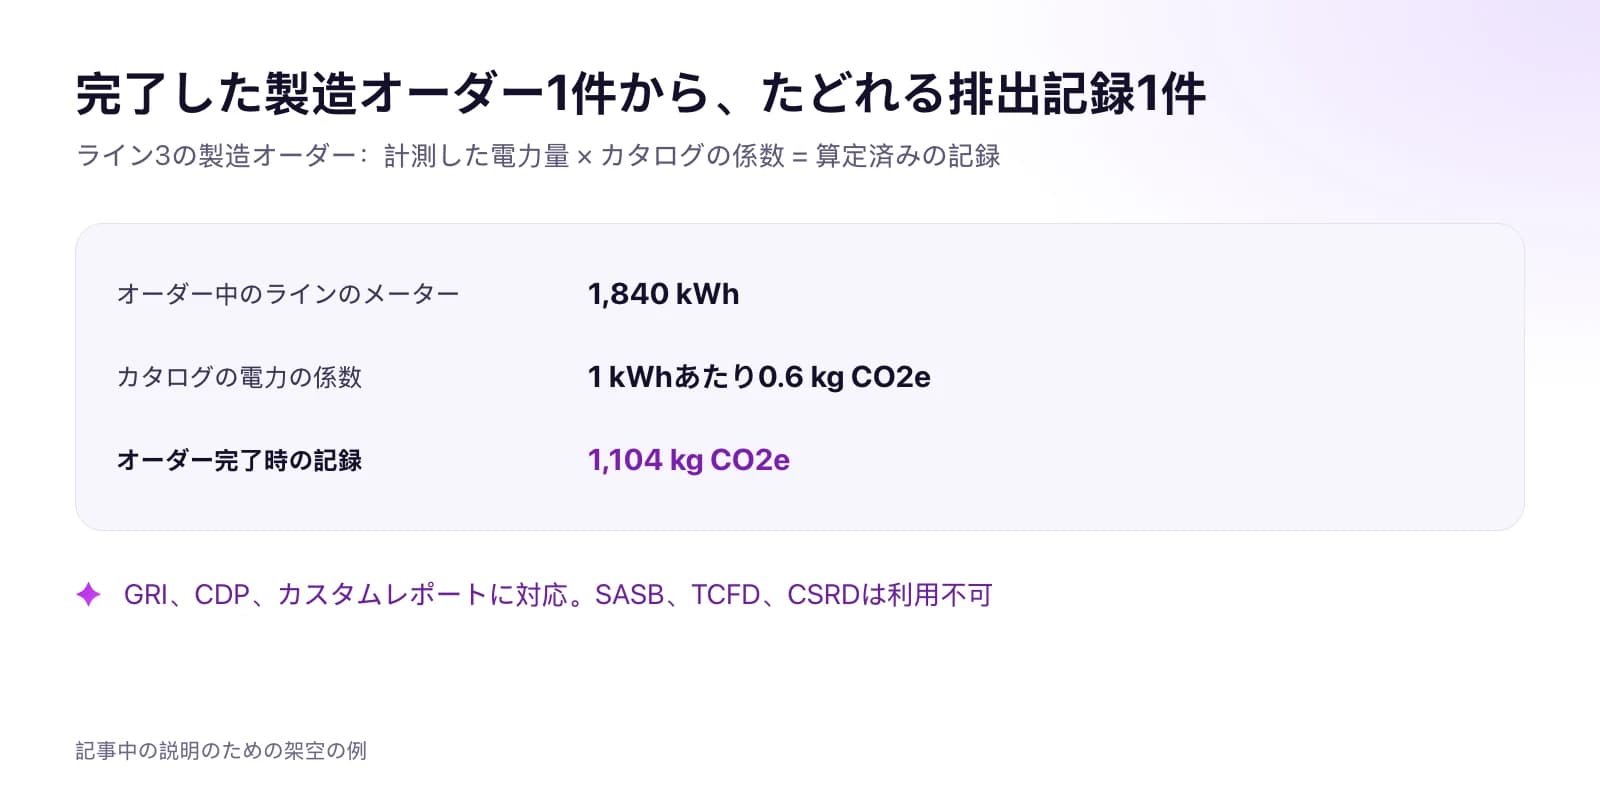 工場のデータからGRIとCDPの排出量報告を作る方法GRI 305とCDPが工場に求めるデータ、各数値の出どころ、年間を通じて整備する4つのステップ、IRIS ESGの対応範囲を解説します。SASB、TCFD、CSRDには非対応です。記事を読む · 10分
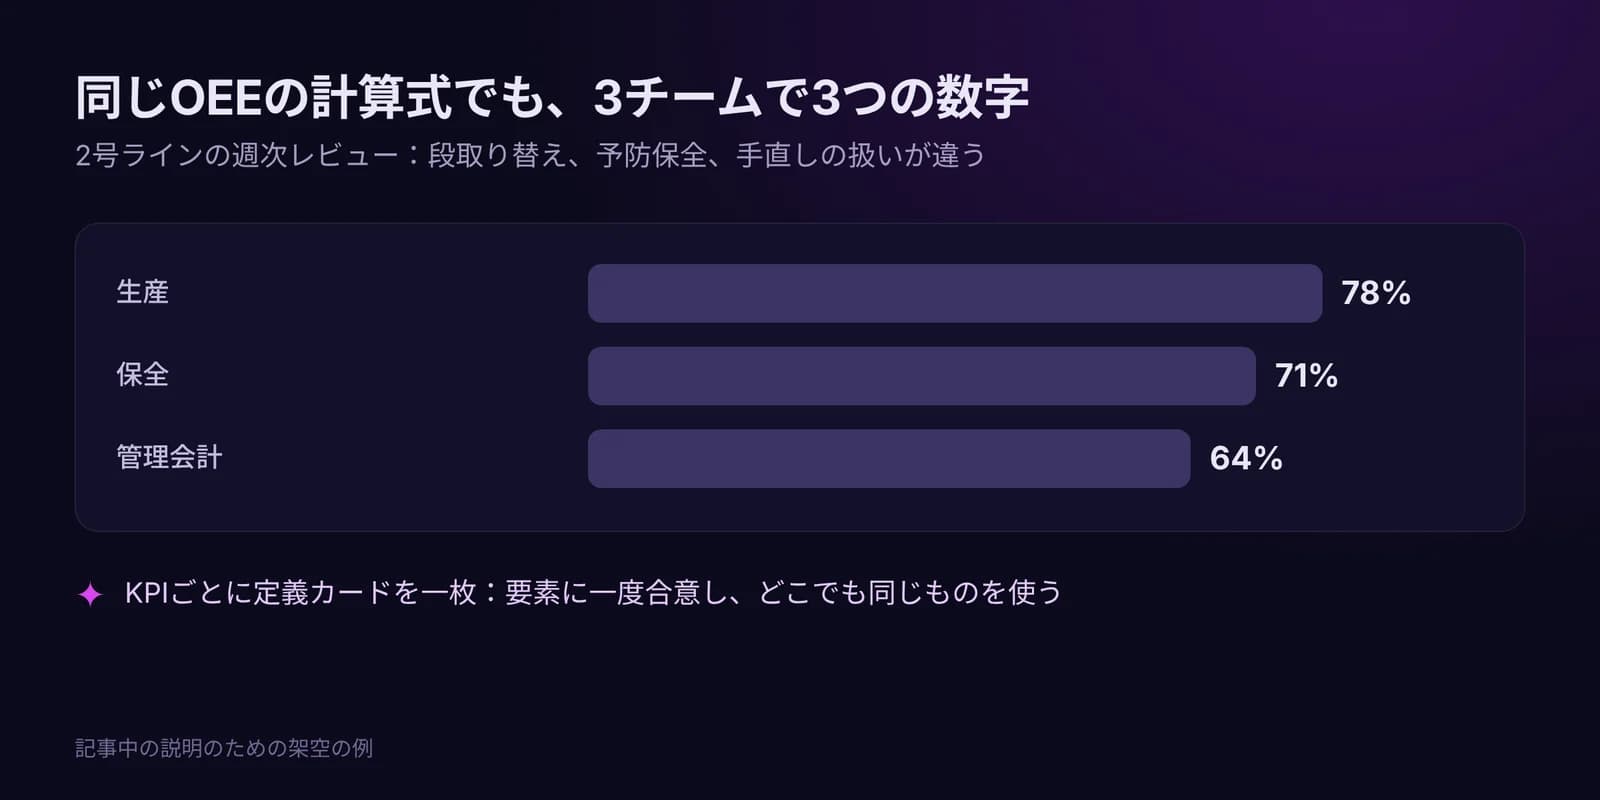
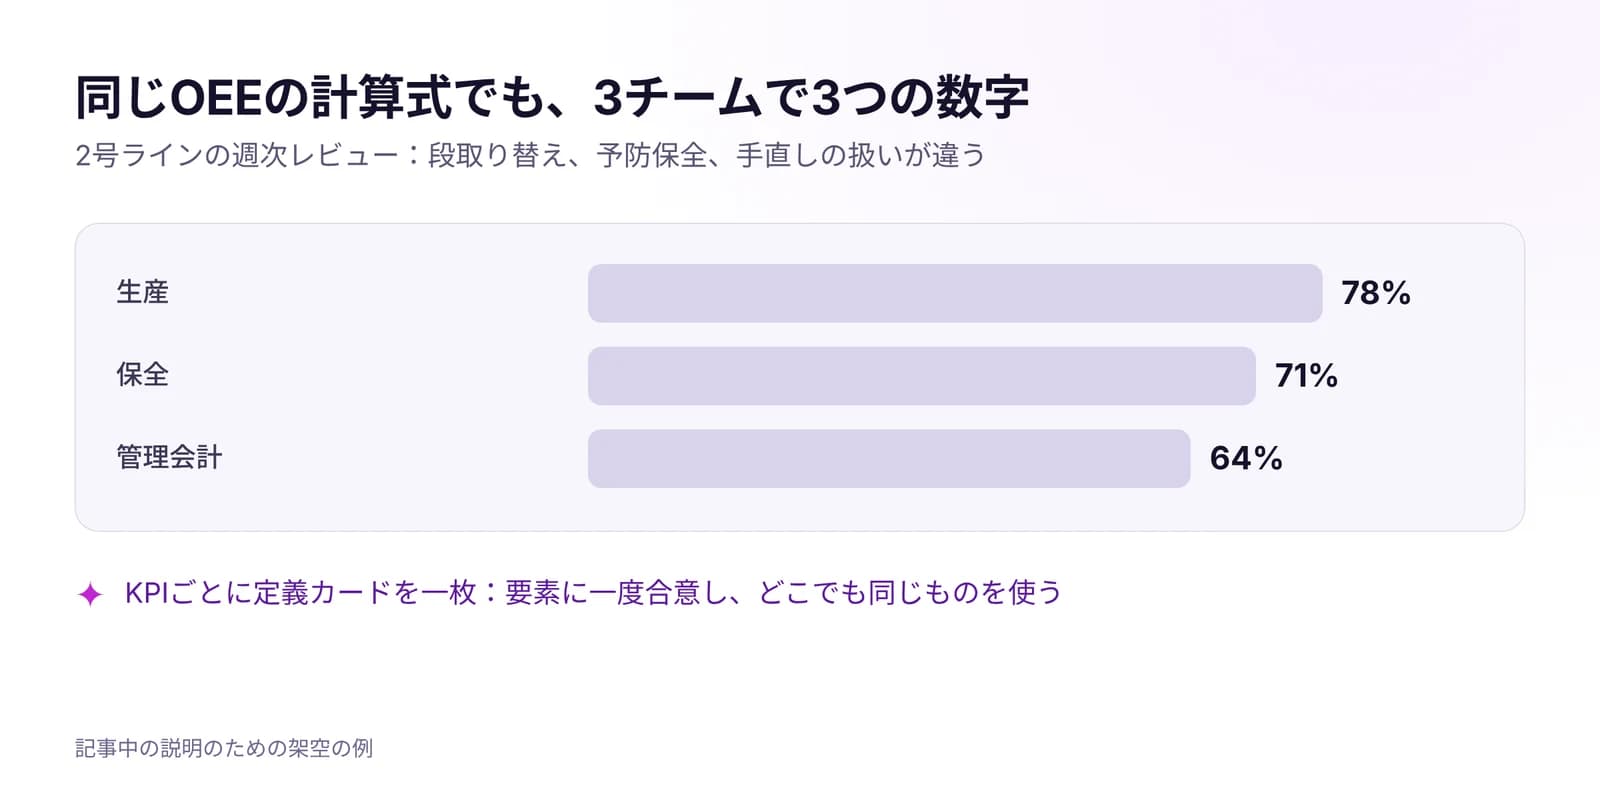 工場のリアルタイムKPIシステムの作り方工場のKPIごとに、定義・データ源・担当者・表示を1つに揃える方法。ISO 22400に基づく4つのステップを、OEEの定義カードの例とともに解説します。記事を読む · 7分
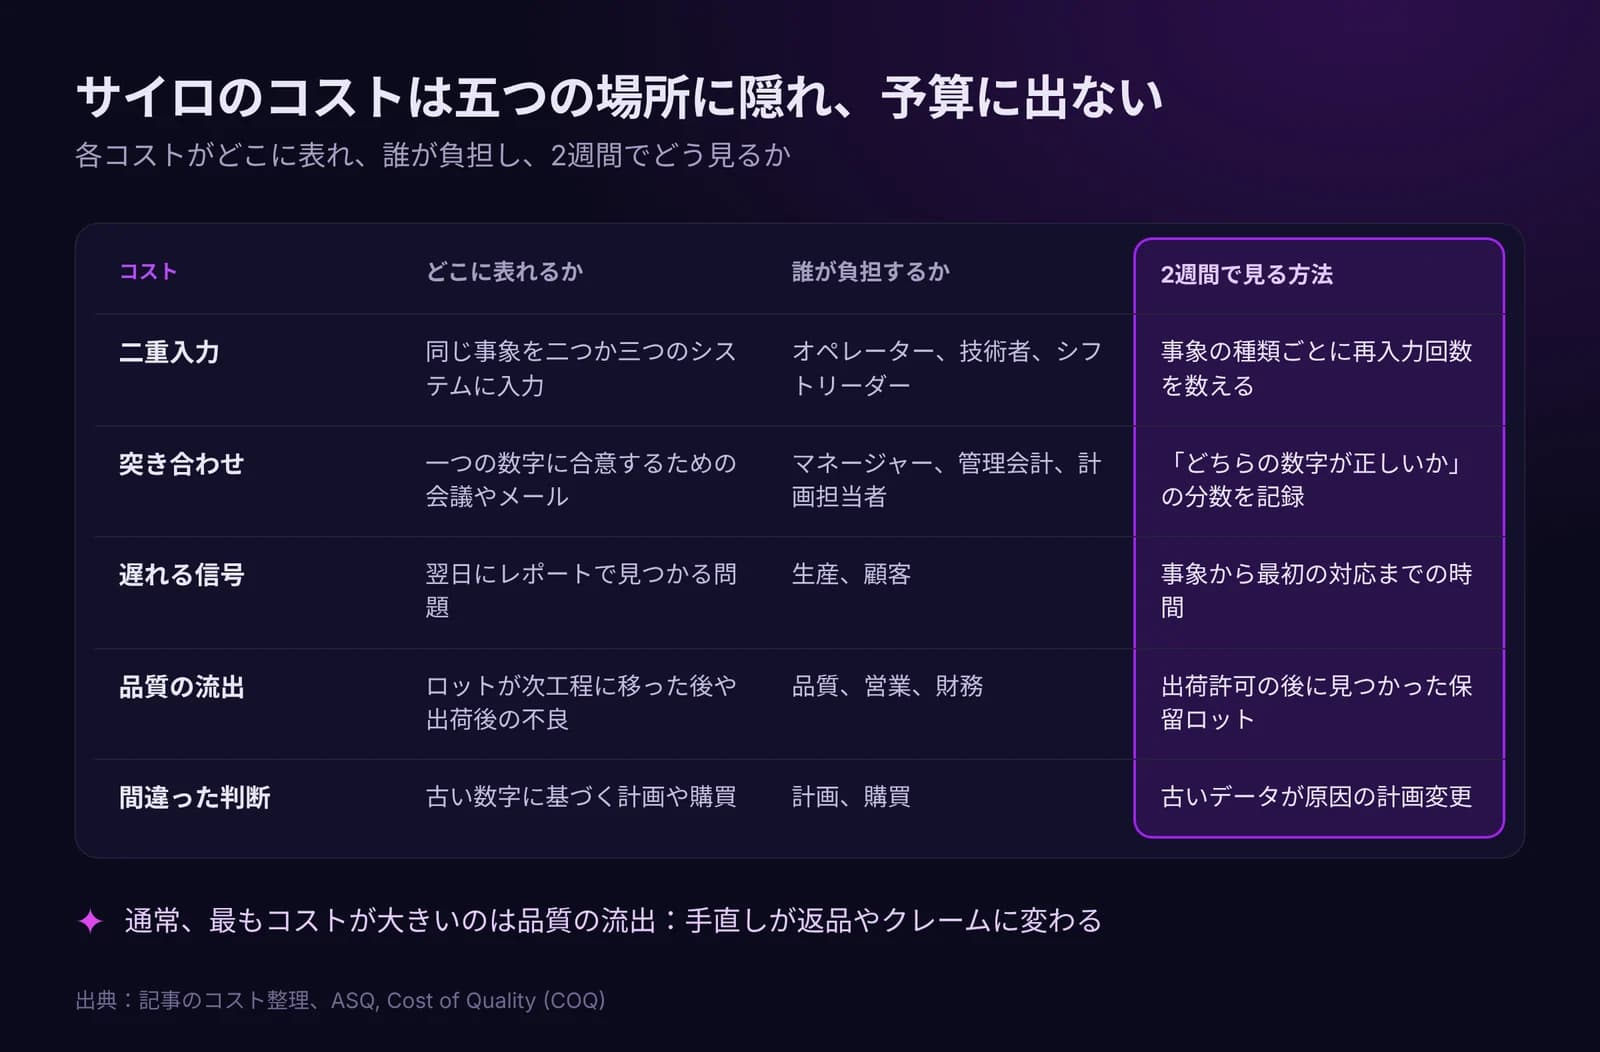
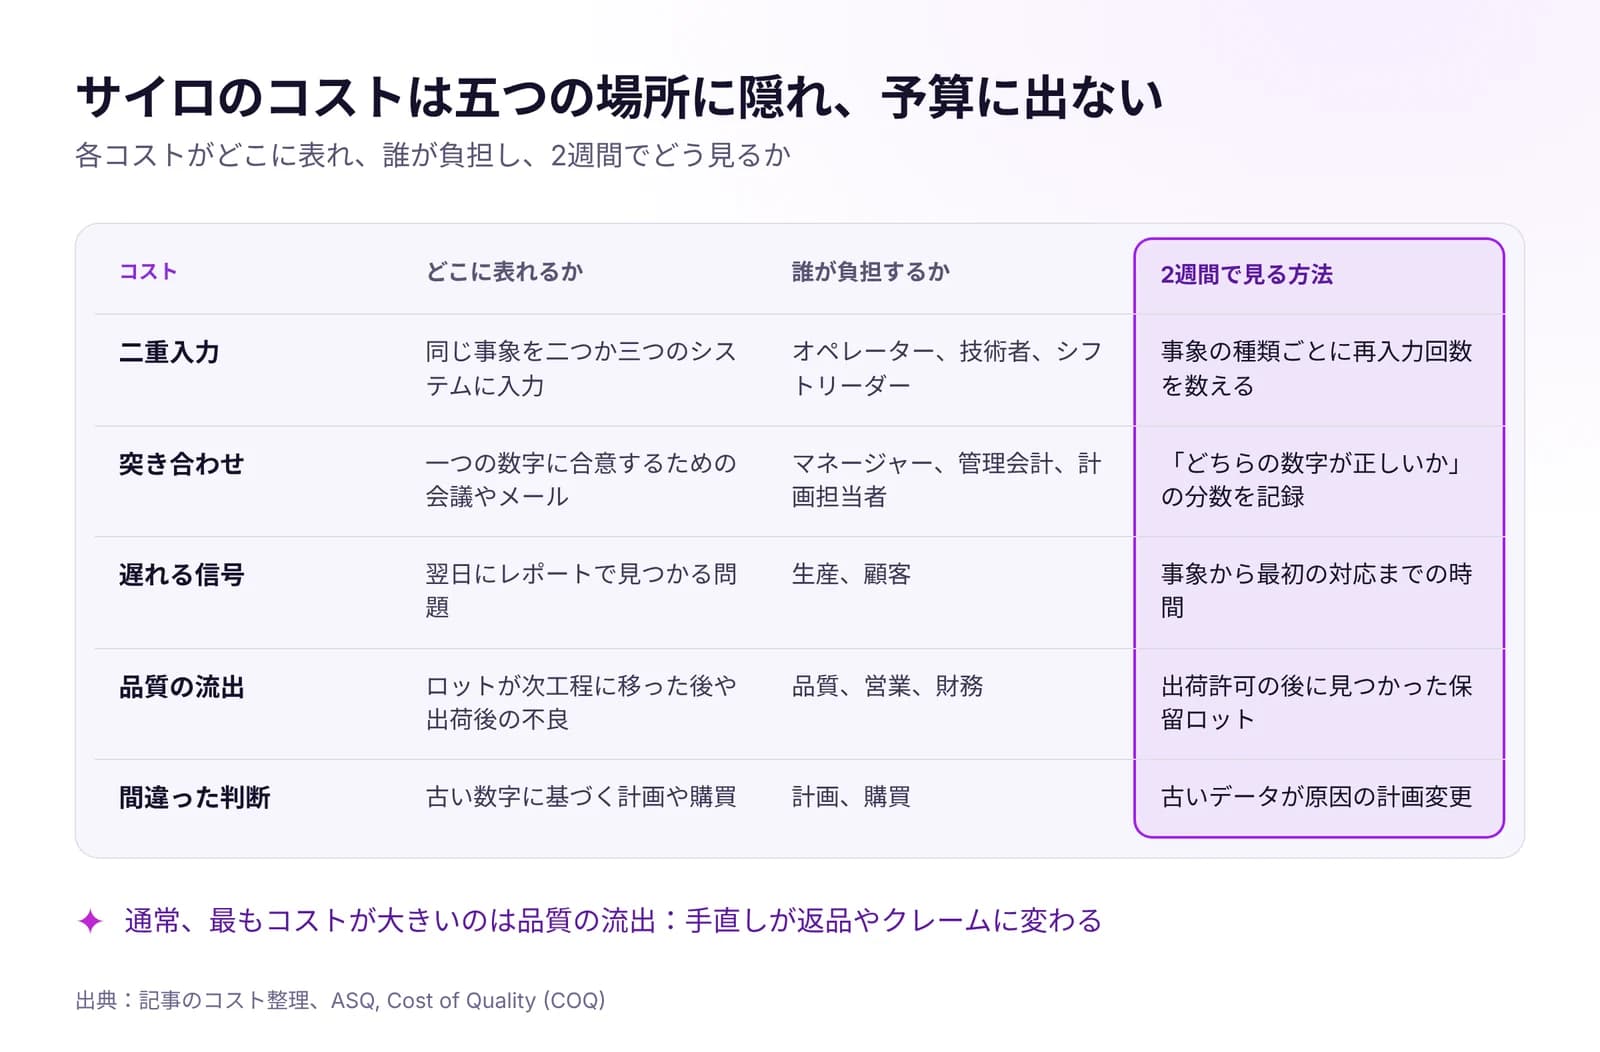 工場でサイロ化したシステムとスプレッドシートが生む本当のコスト分断されたシステムと表計算は、二重入力、数字の突き合わせ、遅れた信号、品質流出というコストを生みます。コストの所在と2週間で測る方法を解説します。記事を読む · 7分