الإنتاج والجودة
أدِر كل أمر إنتاج من الإطلاق حتى الإغلاق
يسجّل المشغّلون الإنتاج والتوقفات والعيوب على الكشك، وتحوّلها MES Production إلى مؤشر OEE وإلى تسليم وردية تؤكده الوردية التالية.
- سليمة
- 1146
- هالك
- 0
- التوقف
- 0دقيقة
سُجّل على الكشك
التوقف 6 دقائق- التوافر
- 88%
- الأداء
- 92%
- الجودة
- 97%
- OEE
- 79%
الخط 1 ينفّذ الأمر PO-2318 على أربع محطات.
ماذا تفعل
- 01
كشك عند كل محطة
يسجّل المشغّلون دخولهم برمز PIN أو ببطاقة RFID، ويبدؤون الأوامر وينهونها، ويبلّغون عن القطع والعيوب والأعطال.
- 02
حساب OEE واحد لكل الشاشات
تستخدم لوحة القيادة والتقارير وKPI / Analytics حسابًا واحدًا للتوافر والأداء والجودة.
- 03
الجودة والتتبع
تقارن مخططات SPC كل قياس بحدود الضبط، وتتتبّع شجرة نسب المنتج كل وحدة وكل دفعة.
شاهده أثناء العمل
الفيديو بالإنجليزية، والترجمة متاحة في المشغّل.
النص المكتوب (بالإنجليزية)
This is the MES Production dashboard in IRIS. At the top you see OEE right now, with availability, performance and quality. Next to it are the output, the orders running, the completed orders and the open downtime. Below is the process flow of your line. Each station shows its name and its live state. The legend names the states: running, idle, andon, planned stop and unplanned stop. Under the flow you find the production orders, with their status, quantity, produced quantity and progress. Recent activity lists the latest events, and the station passes show what each station produced. The downtime list shows downtime from every source. Register downtime adds a new one. Open Performance for the OEE dashboard. It shows the plant OEE right now and ranks the machines. That is enough to get started. Production, Orders and Quality and Traceability are in the same module, so look around there too.
النص المكتوب (بالإنجليزية)
How well does your line really run? Many plants find out at the end of the shift, from a downtime sheet. In IRIS MES Production, the dashboard shows OEE right now, with availability, performance and quality. Every station on the line is on the map with its live state, such as running, idle or stopped. Downtime appears as it happens, with the station and how long it lasts. Machine signals come in through Data Bridge, and IoT shows OEE for each machine. No spreadsheet. No waiting for the end of the shift. Try the free demo at iris.dbr77.com.
من أين تأتي البيانات
- كشك المشغّل: القطع والعيوب والاستراحات والأعطال ونداءات Andon.
- الجداول المنشورة في APS، والأوامر المستوردة من ملفات CSV أو XLSX.
- إنذارات الآلات من IoT وData Bridge. والإنذار الحرج يتحول إلى تنبيه Andon.
معلومات مفيدة
- تأتي الجداول من APS، وتنفّذها MES Production وتعيد إليها حالة الأوامر.
- تتصل الآلات عبر IoT وData Bridge، ولا ترتبط MES Production مباشرة بوحدات PLC.
- تُكتب تعليمات العمل وتعريفات العمليات في Engineering، وتتولى MES Production تنفيذها.
شاشات من العرض التجريبي لـ IRIS
بيانات توضيحية من مصنع IRIS التجريبي. انقر على الشاشة لتكبيرها.
اقرأ المزيد
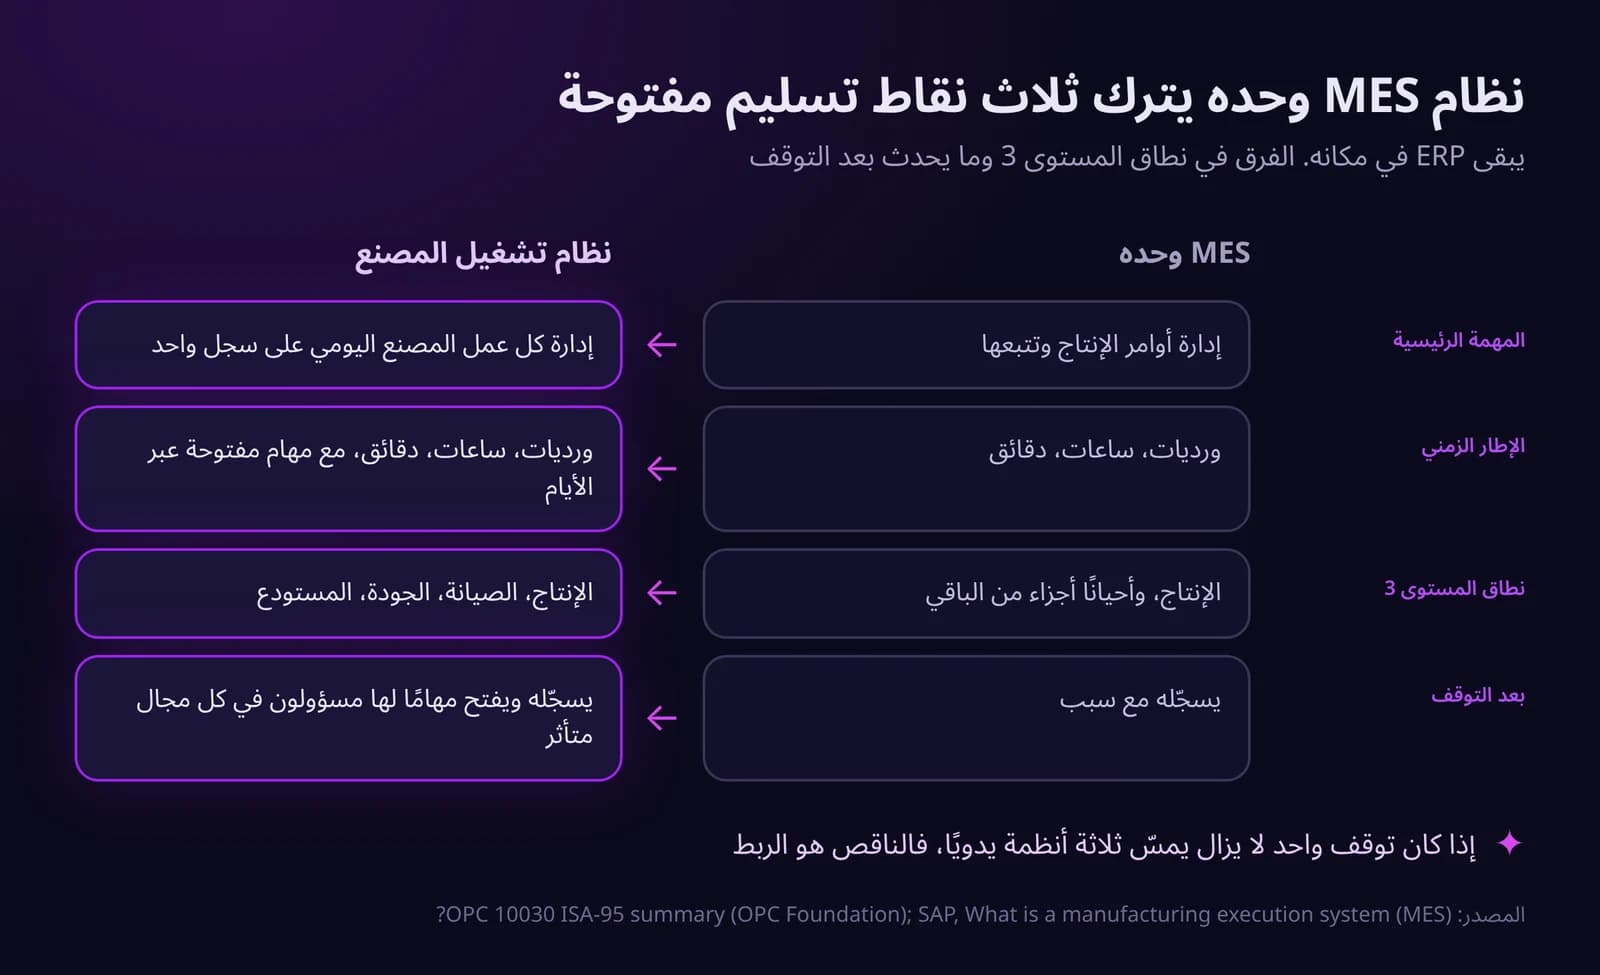
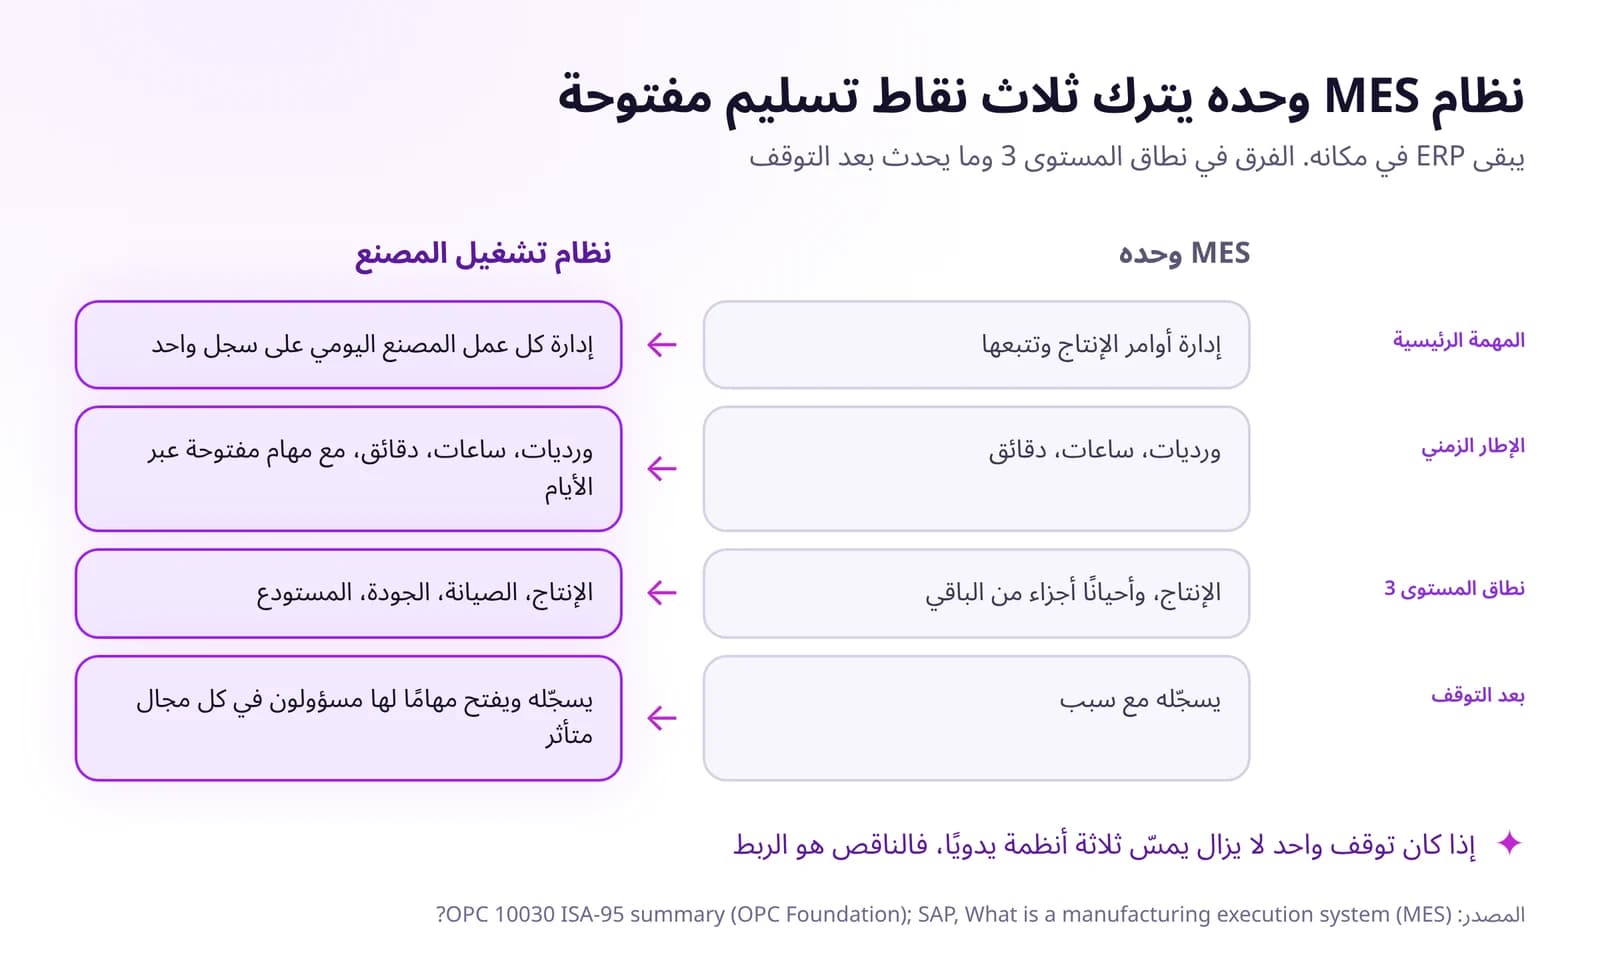 نظام تشغيل المصنع مقابل MES مقابل ERP: من يفعل ماذا في المصنعيخطط ERP للأعمال، ويدير MES أوامر الإنتاج، ويجمع نظام تشغيل المصنع كل عمل المصنع في سجل واحد. تعرّف على دور كل نظام وأين يتوقف MES وحده.اقرأ المقال · 6 د
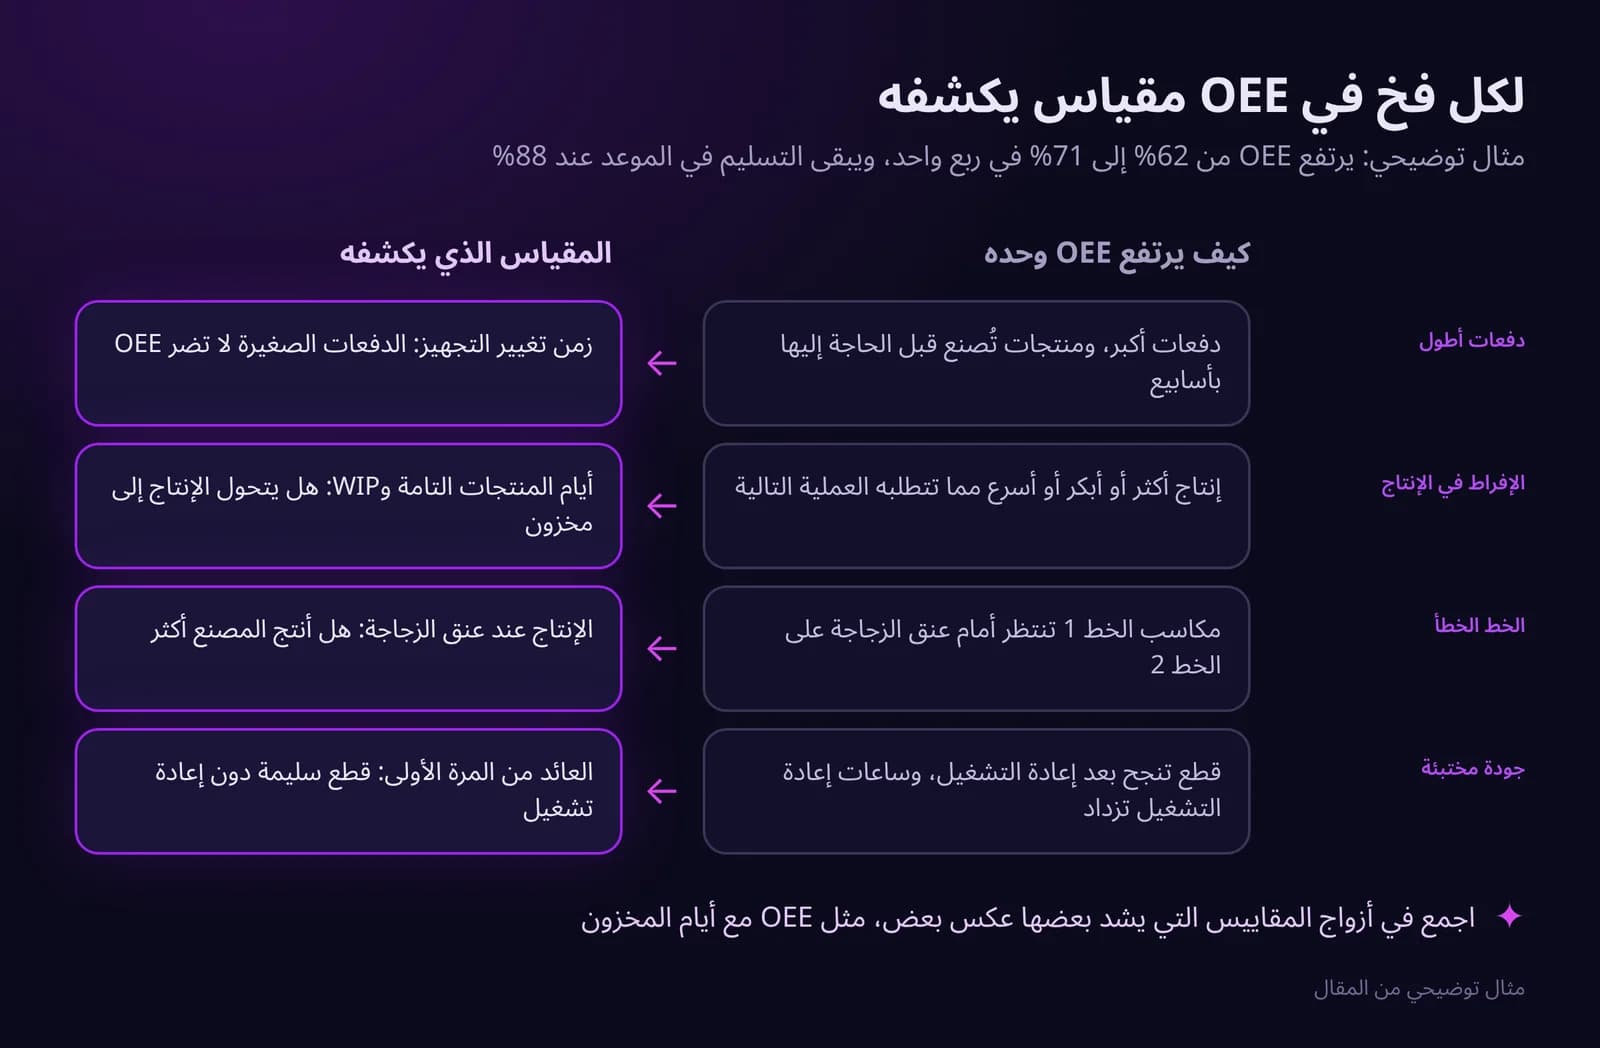
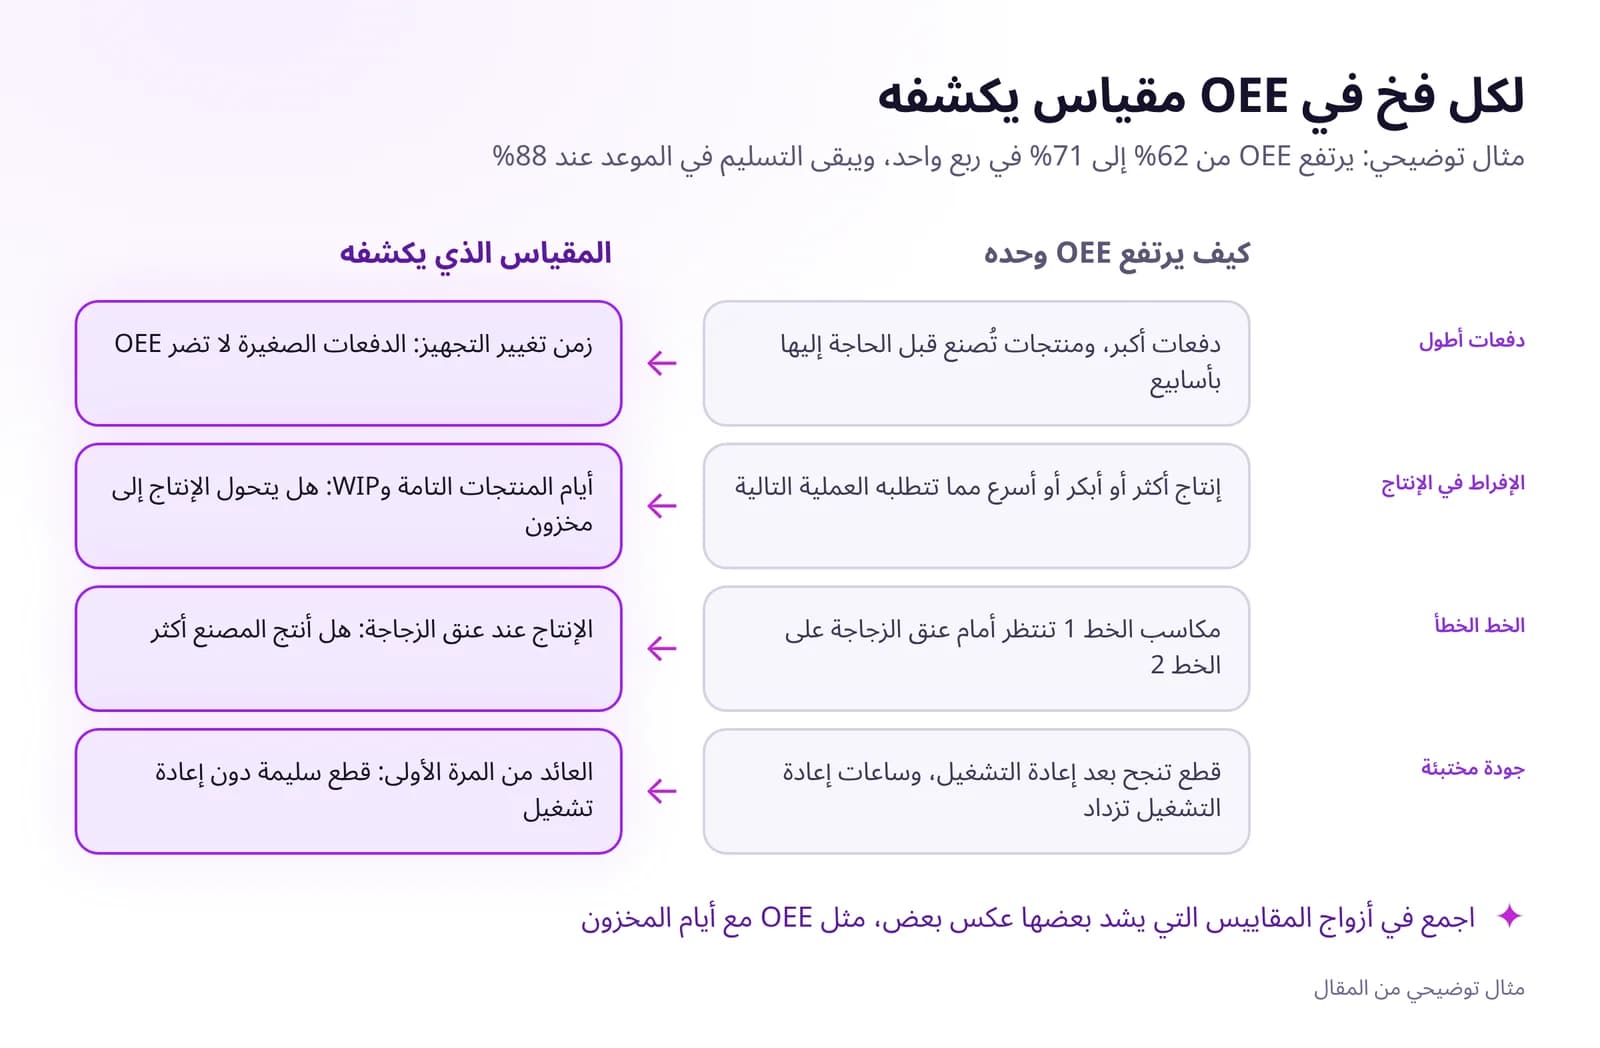 OEE لا يكفي: ما الذي ينبغي قياسه بدلًا من الاكتفاء بمؤشر OEEقد ترتفع OEE بينما يتراجع التسليم في الموعد ويزداد المخزون. خمسة أسباب لذلك، والمؤشرات التي تضيفها بجانبها، وكيف تبني بطاقة أداء قصيرة للمصنع.اقرأ المقال · 6 د
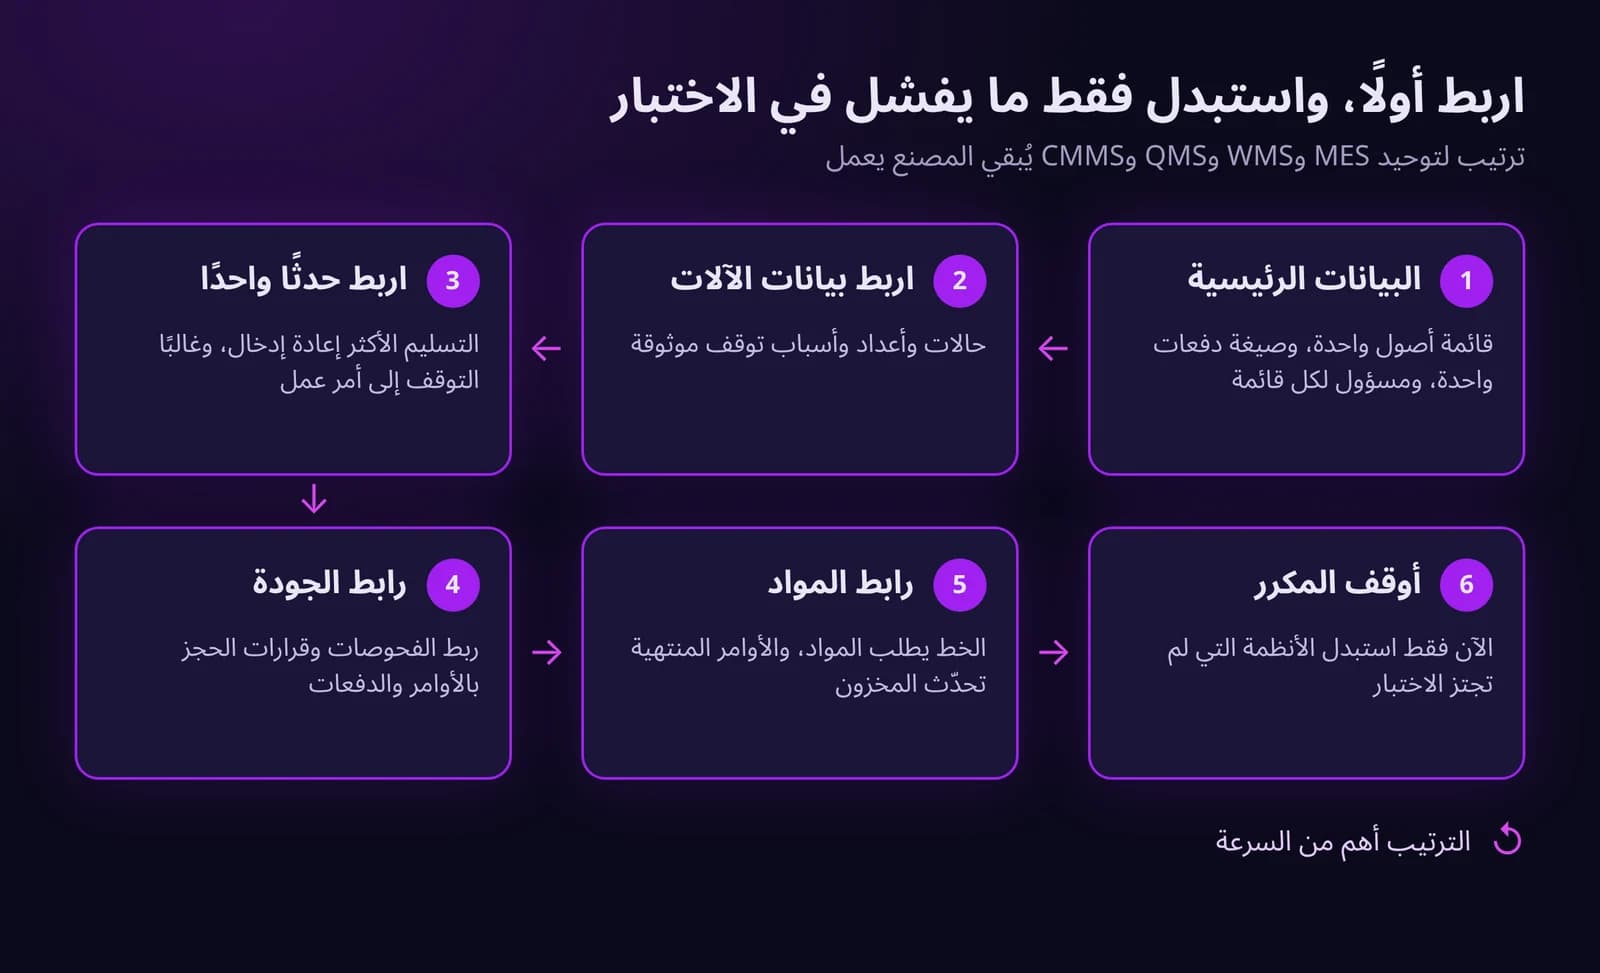
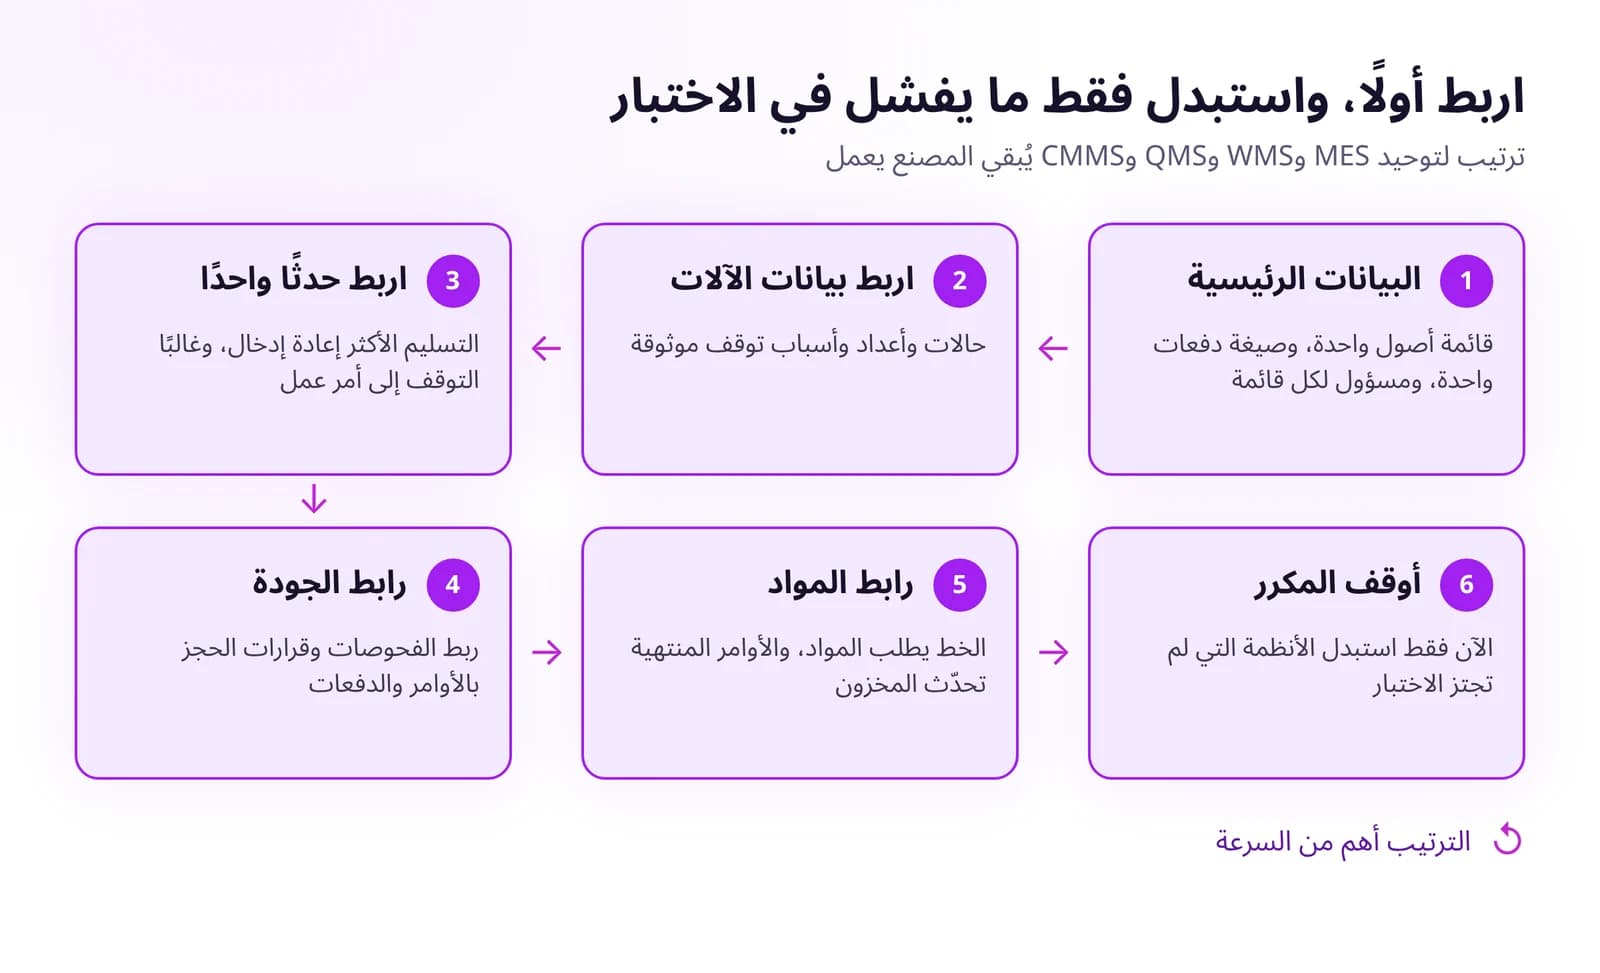 كيف توحّد أنظمة MES وWMS وQMS وCMMS دون استبدال كل شيءوحّد أنظمة MES وWMS وQMS وCMMS دون مشروع استبدال شامل: ابدأ ببيانات رئيسية مشتركة، ثم الأحداث الأساسية، واستبدل النظام فقط عندما يعرقل سير العمل.اقرأ المقال · 6 د
جرّب MES Production في IRIS
ابدأ تجربة لمدة 14 يومًا على بيانات مصنعك، أو افتح العرض التفاعلي ببيانات توضيحية.